Results for
Trump's rate cut talk pushes gold price to new highs
It sounds wild, but that’s exactly what markets are whispering. President Donald Trump is now calling for a 300 basis point interest rate cut - the biggest in US history by a mile
It sounds wild, but that’s exactly what markets are whispering. President Donald Trump is now calling for a jaw-dropping 300 basis point interest rate cut - the biggest in US history by a mile. While that’s raising plenty of eyebrows, one asset is quietly loving the chaos: gold. With safe-haven demand climbing and inflation risks back in the spotlight, could this be the moment gold makes a run at $5,000?
Trump’s interest rate cut push
To put it plainly, a 300-point cut would be three times larger than the Fed’s record-breaking 100 bps slash in March 2020, during peak pandemic panic. Back then, gold soared, the dollar sank, and investors braced for inflation.
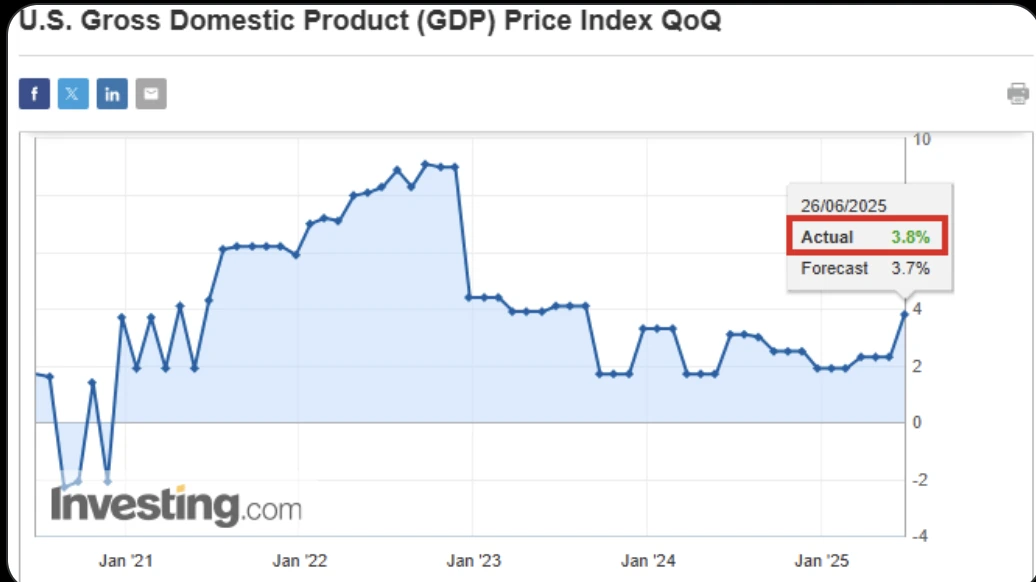
Now? Trump is pushing for a cut of that magnitude in a growing economy. The US is not in recession. In fact, GDP is running hot at 3.8% year-on-year.
Yet Trump argues that high interest rates are costing the US dearly in debt servicing - over $1.2 trillion annually, or roughly $3.3 billion a day in interest payments.
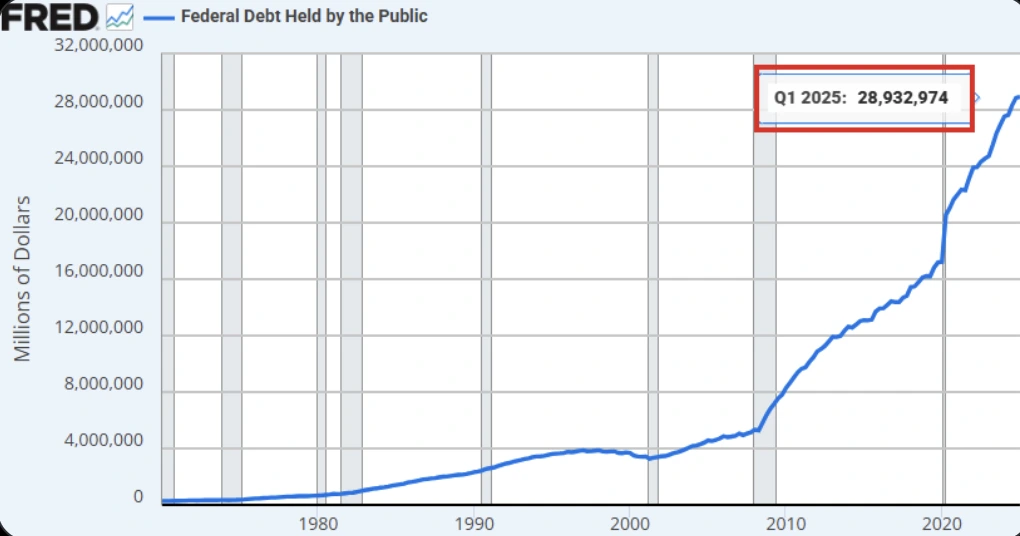
According to Trump, every 1% cut could save around $360 billion on $36 trillion in debt. But that number’s a bit fuzzy. In reality, only publicly held debt (about $29 trillion) is affected, and not all of it can be refinanced overnight.
Still, according to experts, the math points to potential savings of $870 billion per year if a full 3% cut were applied. More realistically, if just 20% of the debt is refinanced in year one, it could still shave off $174 billion - not pocket change.
Gold safe haven demand rises amid trade tensions
While markets digest the economic logic, gold has quietly rallied for three days straight, edging towards the top of its weekly range. Behind the scenes, Trump has also reignited a full-blown trade war, issuing more than 20 tariff notices in just one week, including a 35% tariff on Canadian imports and steep duties on Brazil and copper.
Investors are understandably jittery. Trade tensions are typically bad news for global growth, but they’re great news for gold. The yellow metal thrives in times of uncertainty. Add a falling US dollar (down over 10.8% in Q1 and Q2 - its worst start to a year since 1973), and the mix becomes even more gold-friendly.
The Federal Reserve interest rate factor
Normally, rising gold prices would coincide with growing expectations for a Fed rate cut. But here’s the twist - those expectations have cooled. The Fed’s latest meeting minutes showed division among officials. Some want cuts soon. Others see no urgency at all.
On one hand, San Francisco Fed President Mary Daly suggested rates could come down eventually, saying current policy remains restrictive. On the other, St. Louis Fed President Alberto Musalem struck a more cautious tone, warning it’s too early to gauge the full inflationary impact of tariffs. And Christopher Waller, a known dove and possible Powell successor, called for an early cut - but insisted it wouldn’t be political.
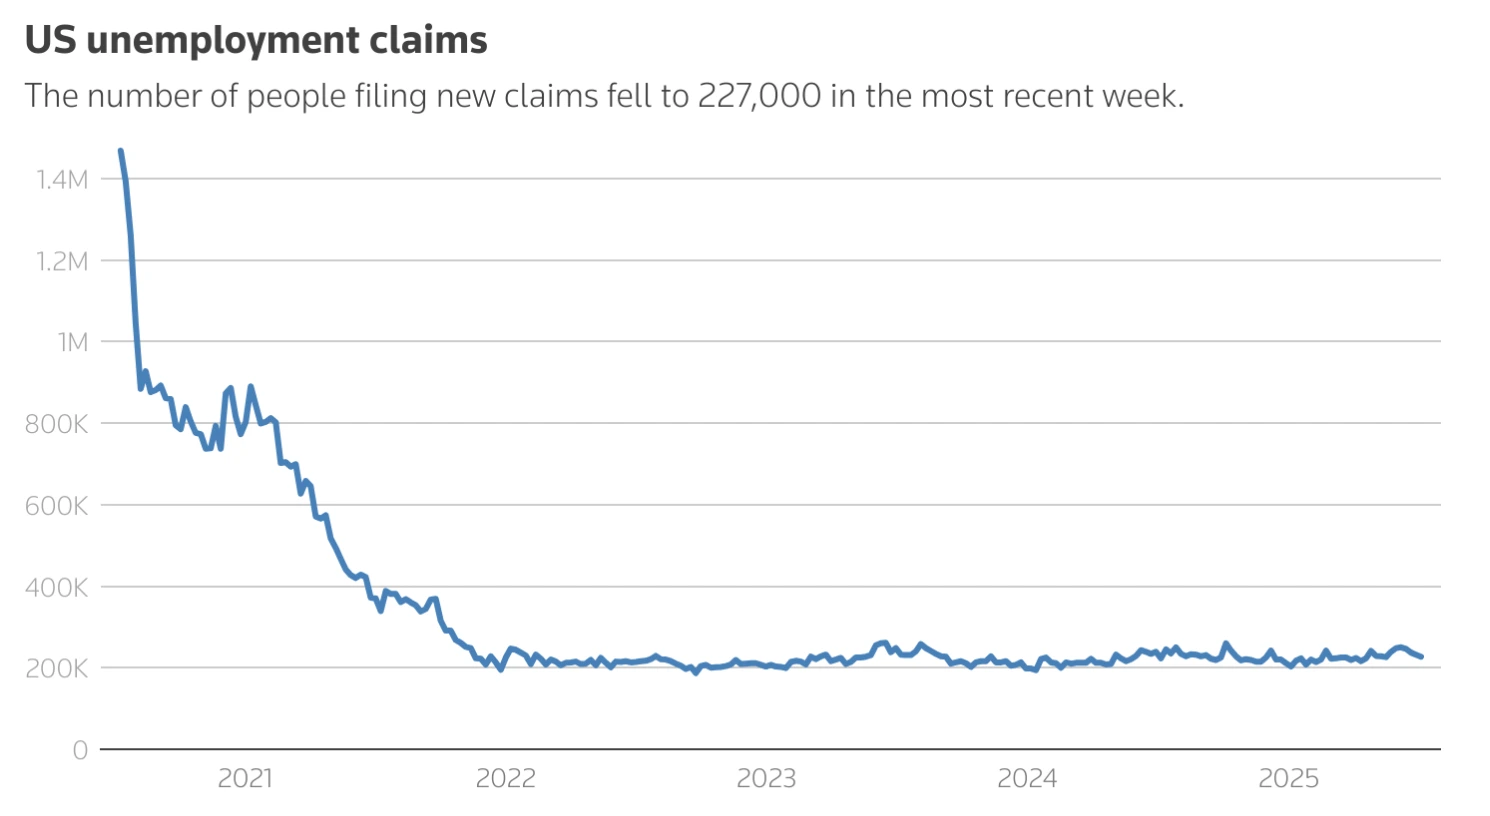
For now, the Fed seems stuck between strong job data and inflation risk. Initial jobless claims recently fell to 227,000, beating forecasts and signalling labour market resilience. That’s made the central bank wary of cutting too soon - even as Trump turns up the heat.
Gold forecast: Could it really hit $5,000?
Here’s the bullish case. If the Fed were to follow through on Trump’s wishes (or even partially), it would likely:
- Drive the dollar lower
- Ignite inflation expectations
- Stoke a safe-haven rush
- And potentially send gold on a parabolic move
Some analysts believe this scenario could send gold past $5,000 per ounce, especially with ongoing trade disruptions and global policy divergence in play. Gold is already up 40% over the past year, and 80% over five years - momentum is on its side.
And if all that sounds familiar, it’s because we’ve been here before. Post-2020, rate cuts and stimulus pushed gold to then-record highs. The environment now may be different, but the cocktail of trade wars, political drama, and central bank pressure is starting to taste a lot like déjà vu.
Gold technical outlook
Trump’s 300-point rate cut proposal might never happen, but the mere suggestion of it is reshaping market psychology. It’s fanning the flames of inflation fears, weakening the dollar, and bolstering demand for assets like gold.
So could gold hit $5,000? If the stars align, rate cuts, trade wars, a softening Fed, then yes, the path is there. Whether or not it takes that path is the real story investors will be watching.
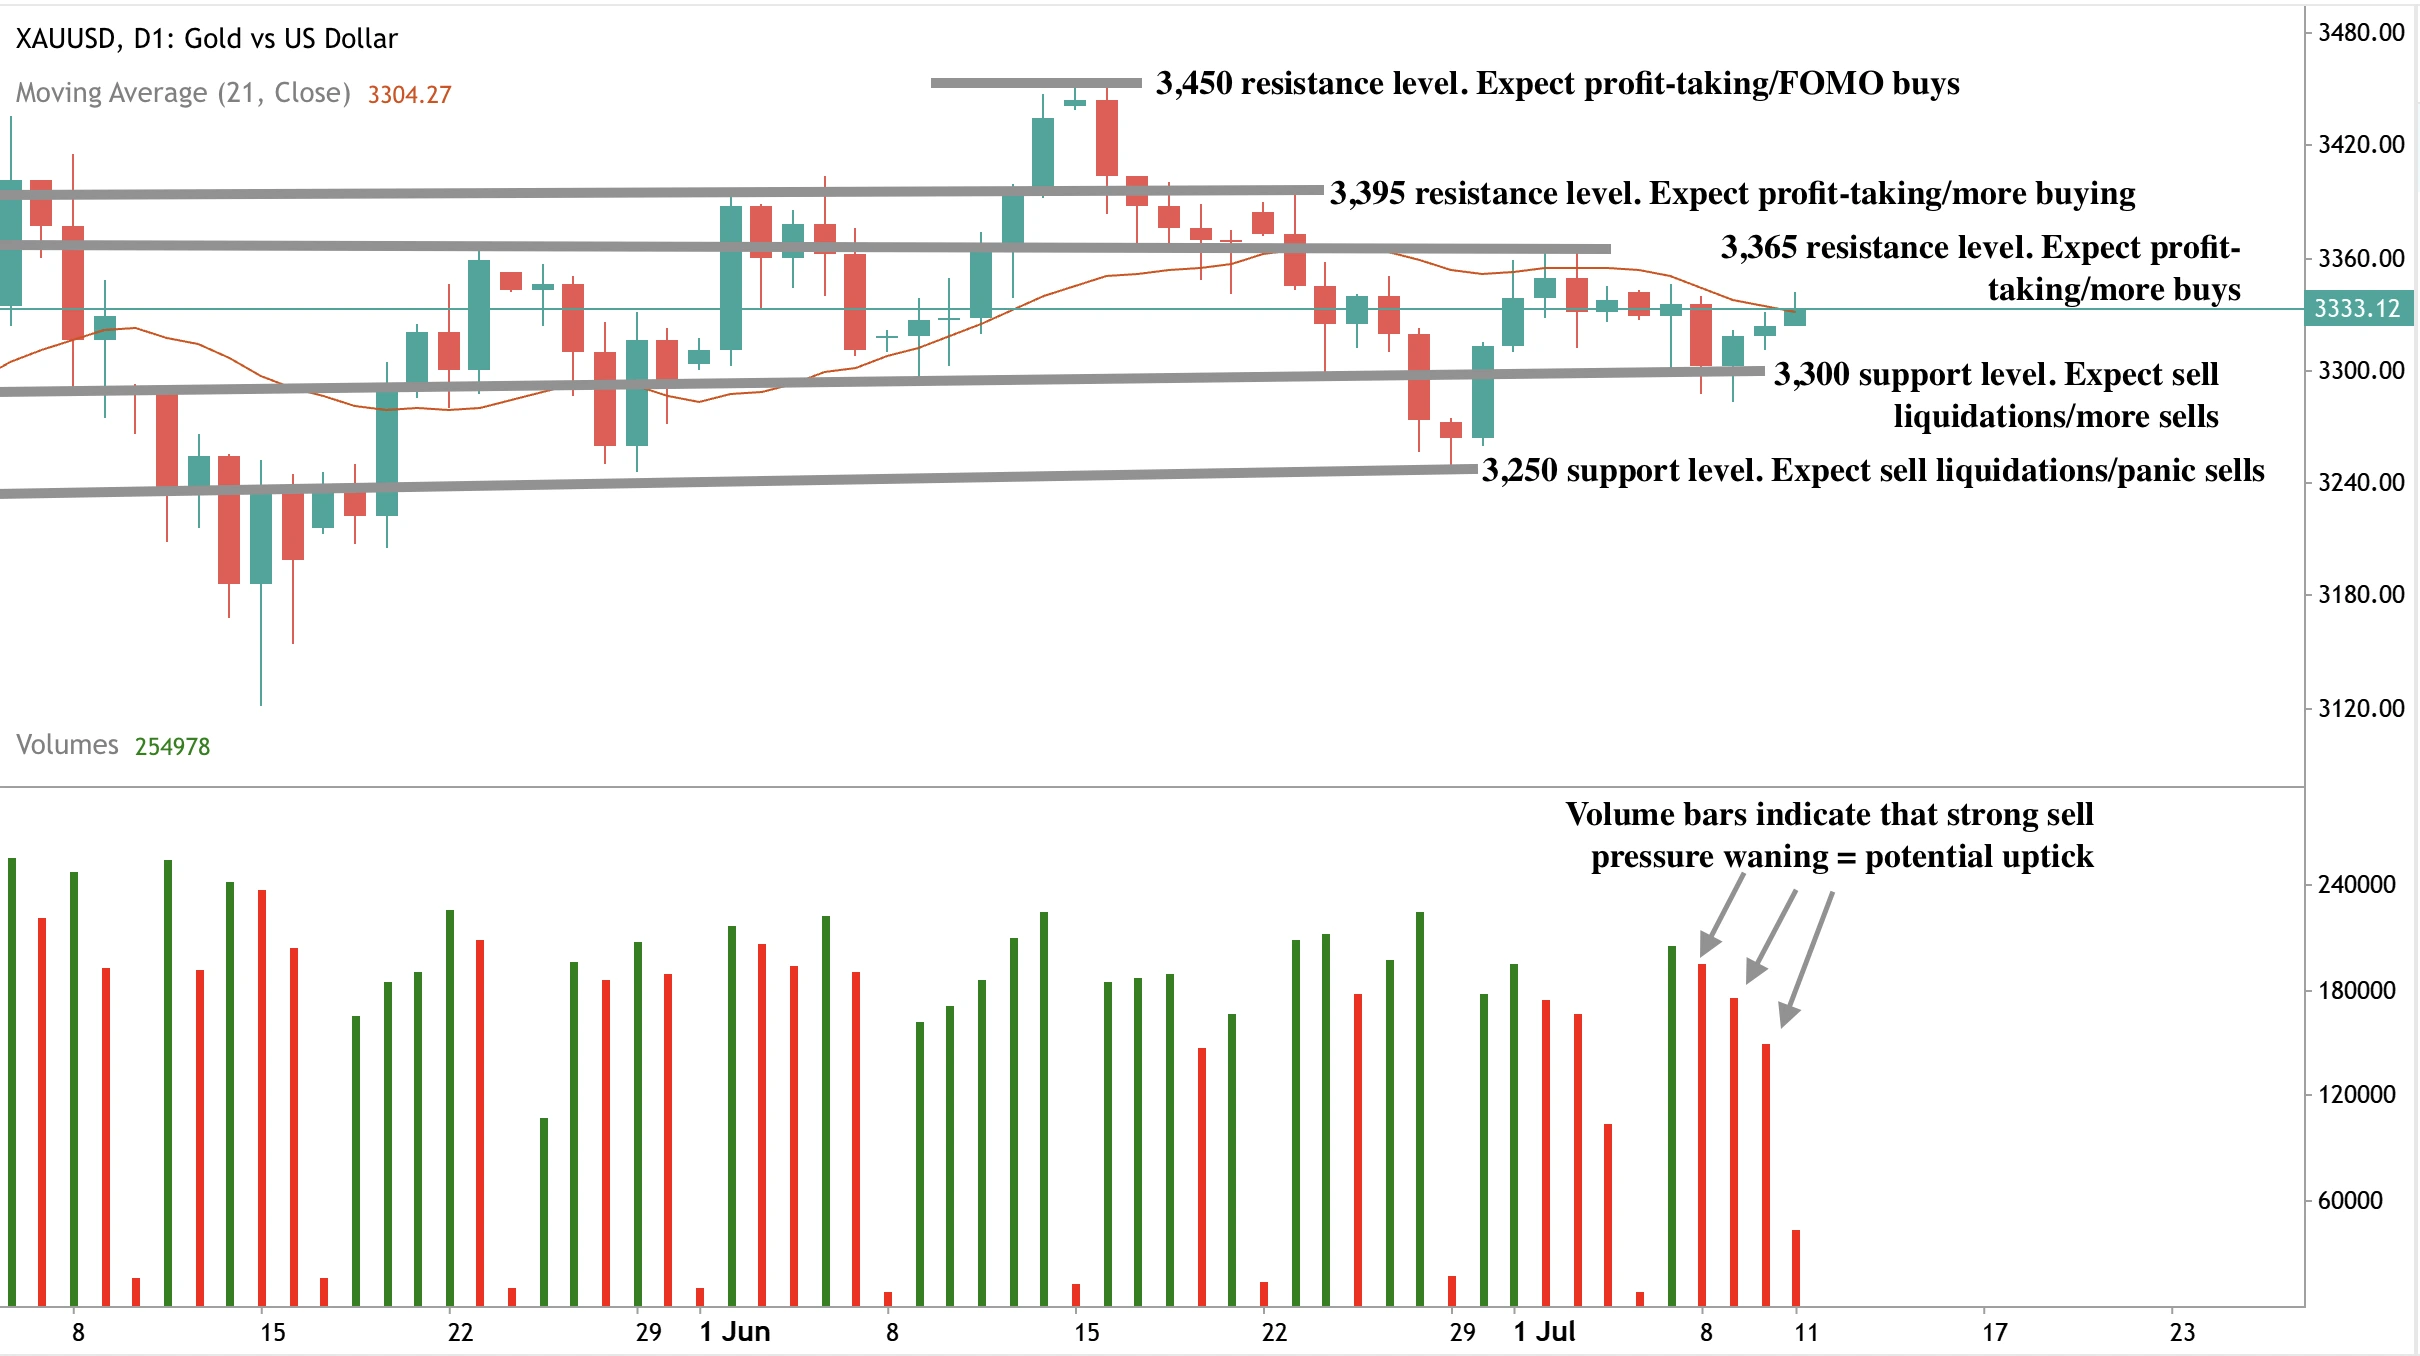
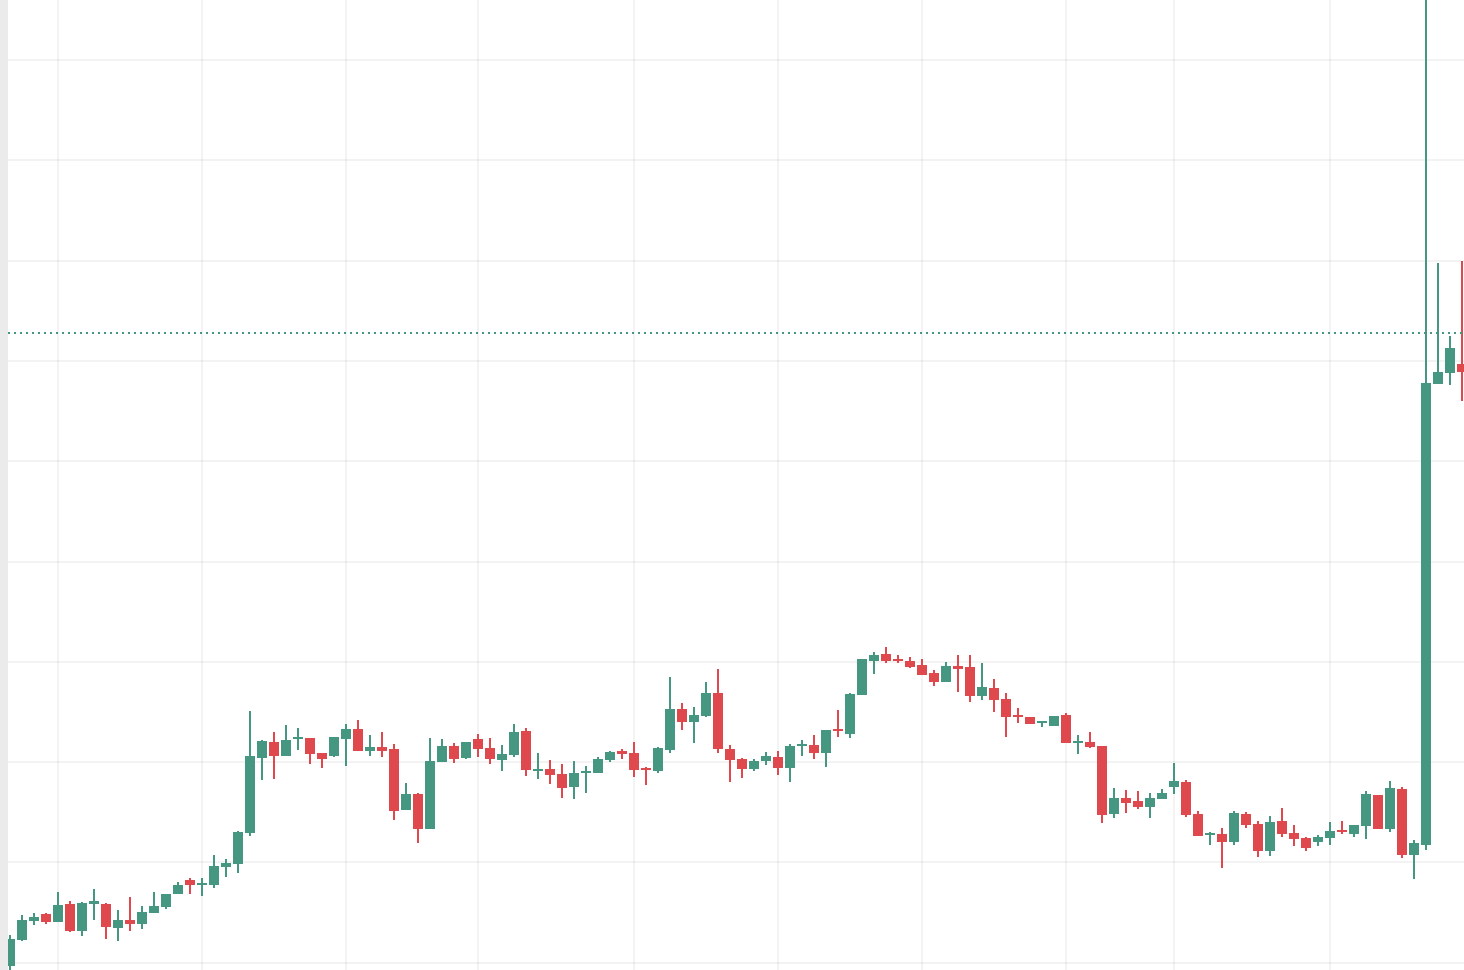
At the time of writing, Gold is seeing a significant uptick within a sell zone, hinting that the uptick may be curtailed. However, the volume bars indicate waning sell pressure, hinting at a potential uptick. If we see an uptick, prices could be held at the $3,365, $3,395, and $3,450. Conversely, if we see a slump, prices could find support at the $3,300 and $3,250 support levels.
Could gold hit 5K? You can speculate on the price of Gold with a Deriv MT5 or Deriv cTrader account.
Bitcoin price all-time high has bulls chasing 120K
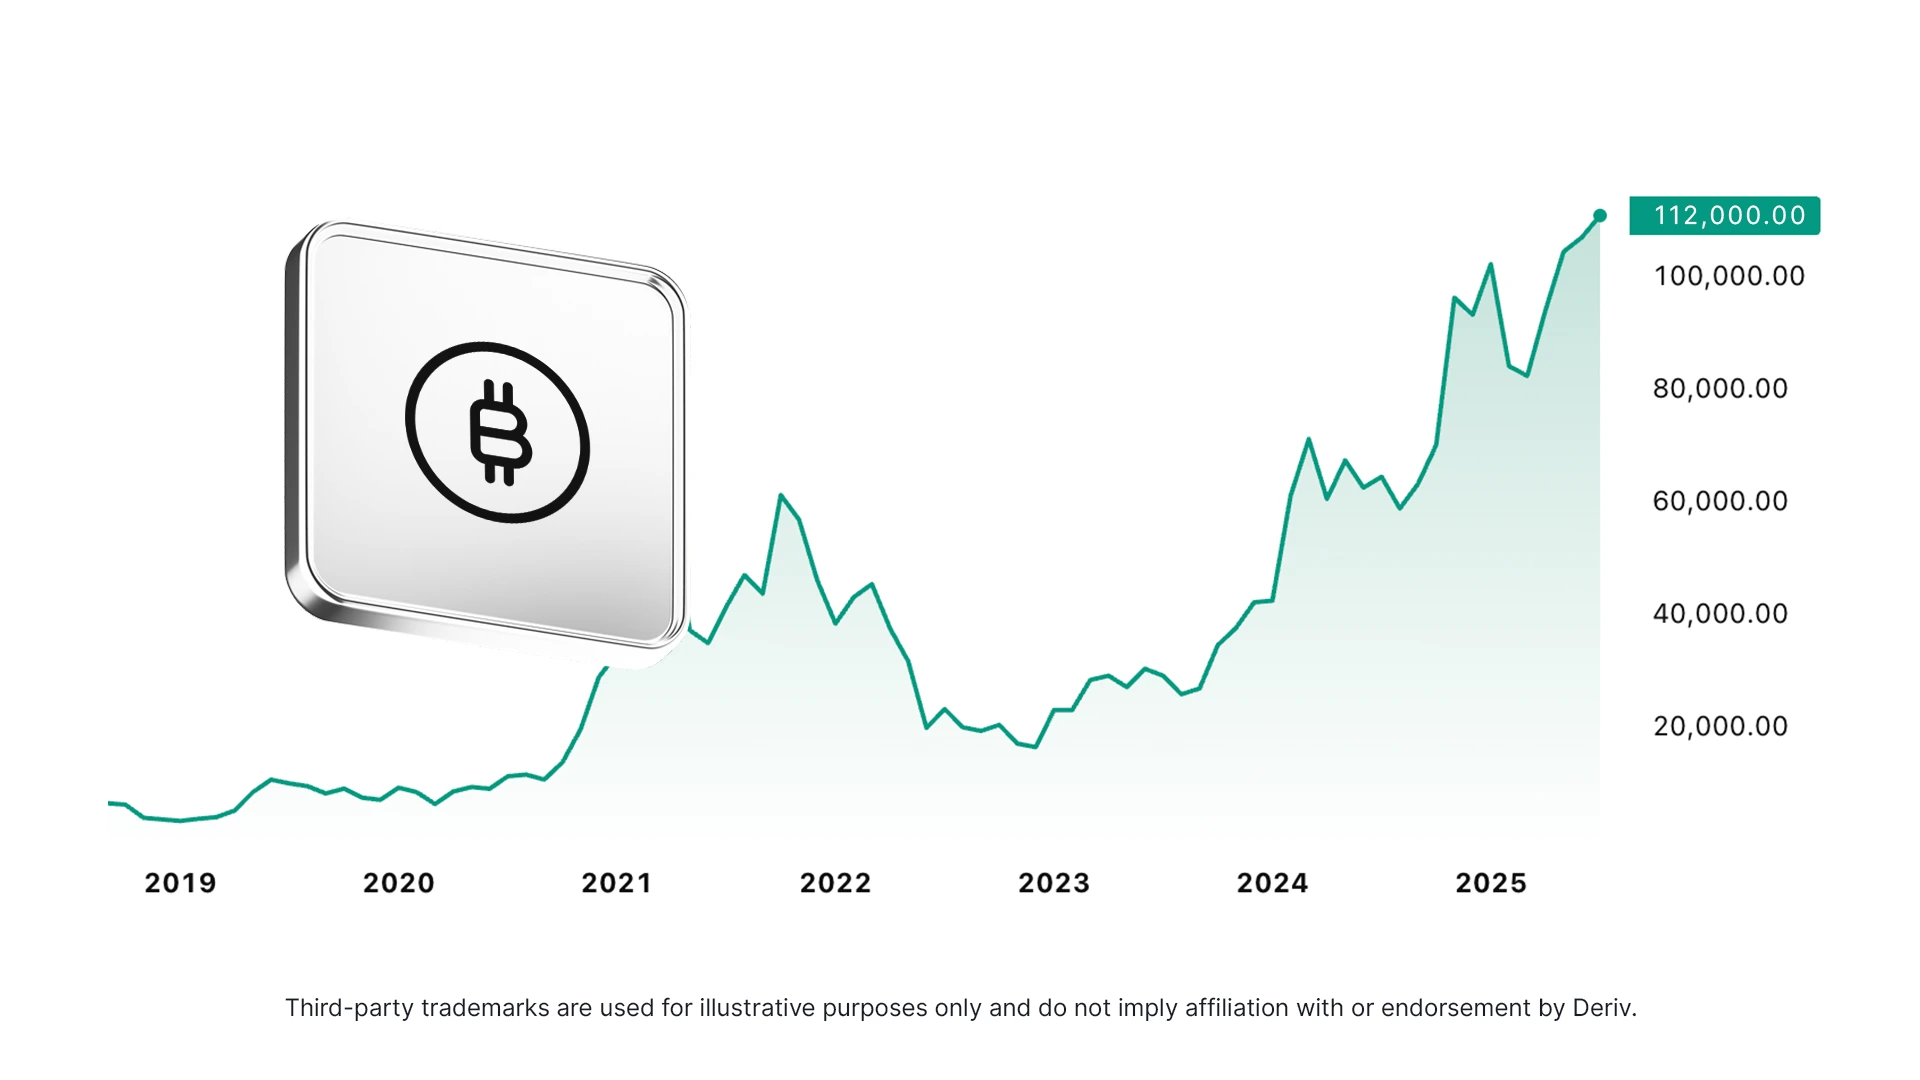
Bitcoin’s back in the spotlight and it’s not messing about. After smashing through its all-time high to top $112K, the world’s favourite cryptocurrency is once again testing the limits of what’s possible.
Bitcoin’s back in the spotlight and it’s not messing about. After smashing through its all-time high to top $112K, the world’s favourite cryptocurrency is once again testing the limits of what’s possible. With momentum building and the charts lighting up, the big question is doing the rounds: is $120K just around the corner, or are we getting ahead of ourselves?
Let’s unpack what’s driving the rally - and whether this time, it really is different.
A bitcoin price rally fuelled by more than just hype
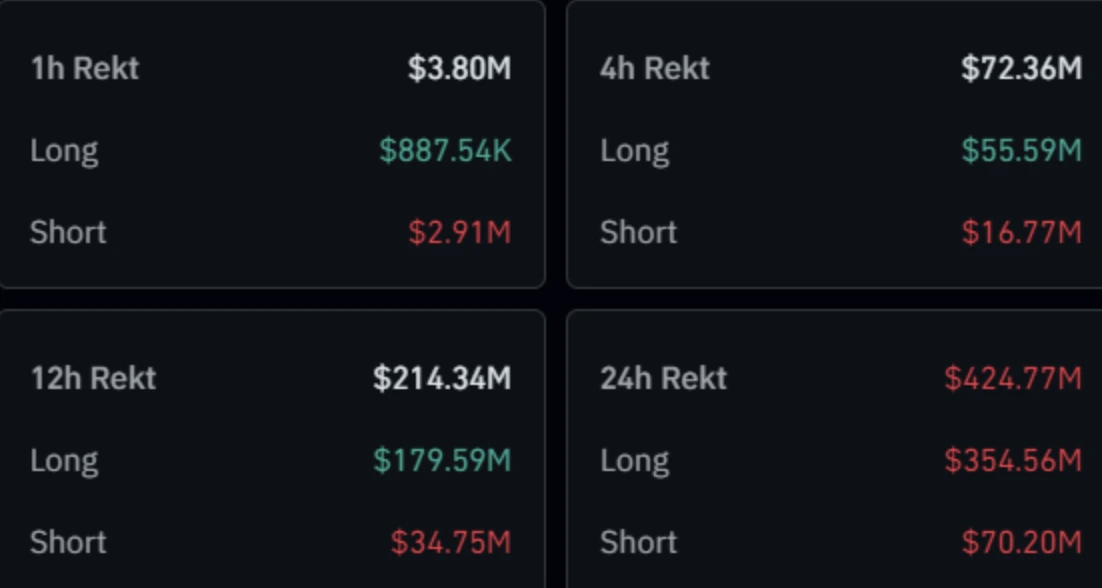
This latest surge didn’t come out of nowhere. It was supercharged by the liquidation of over $425 million in leveraged short positions - a classic short squeeze that sent Bitcoin flying past the long-standing $110K resistance zone.
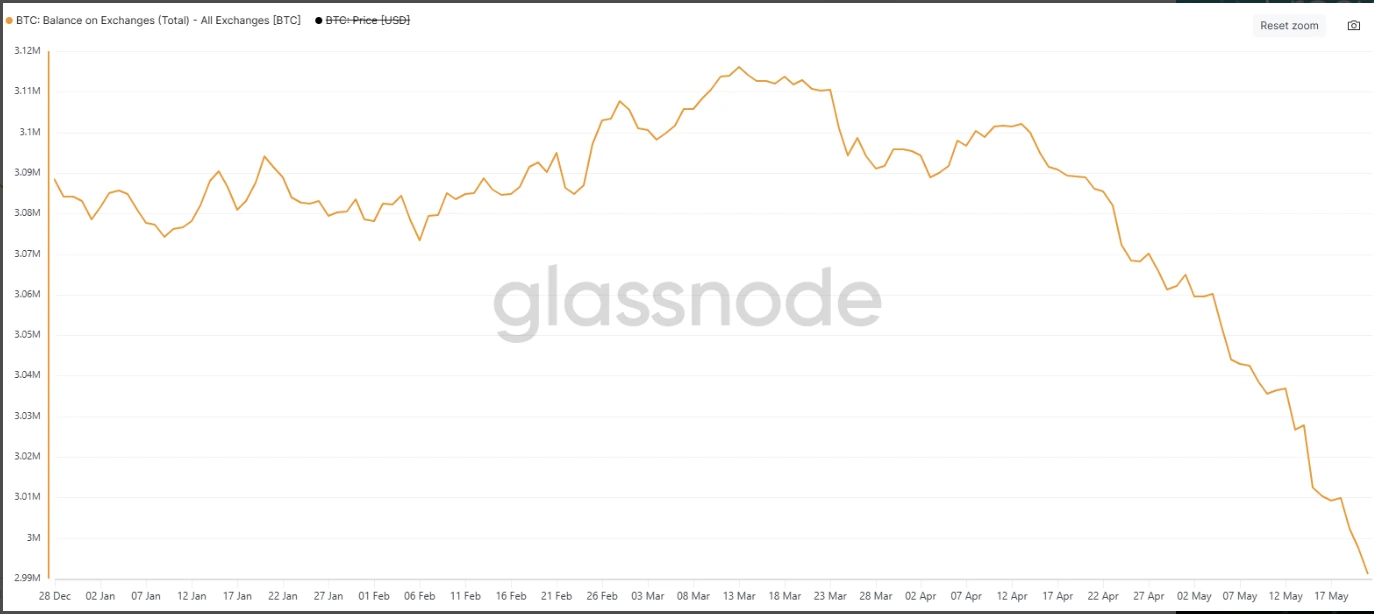
But unlike previous spikes that fizzled out as fast as they appeared, analysts say this one has substance. The momentum is being powered by real demand. According to analysts, people aren’t just banking on price moves - they’re buying to hold. Exchange reserves have dropped to their lowest since March, suggesting long-term conviction is on the rise. It’s less froth, more foundation.
Institutions pile into Bitcoin ETFs
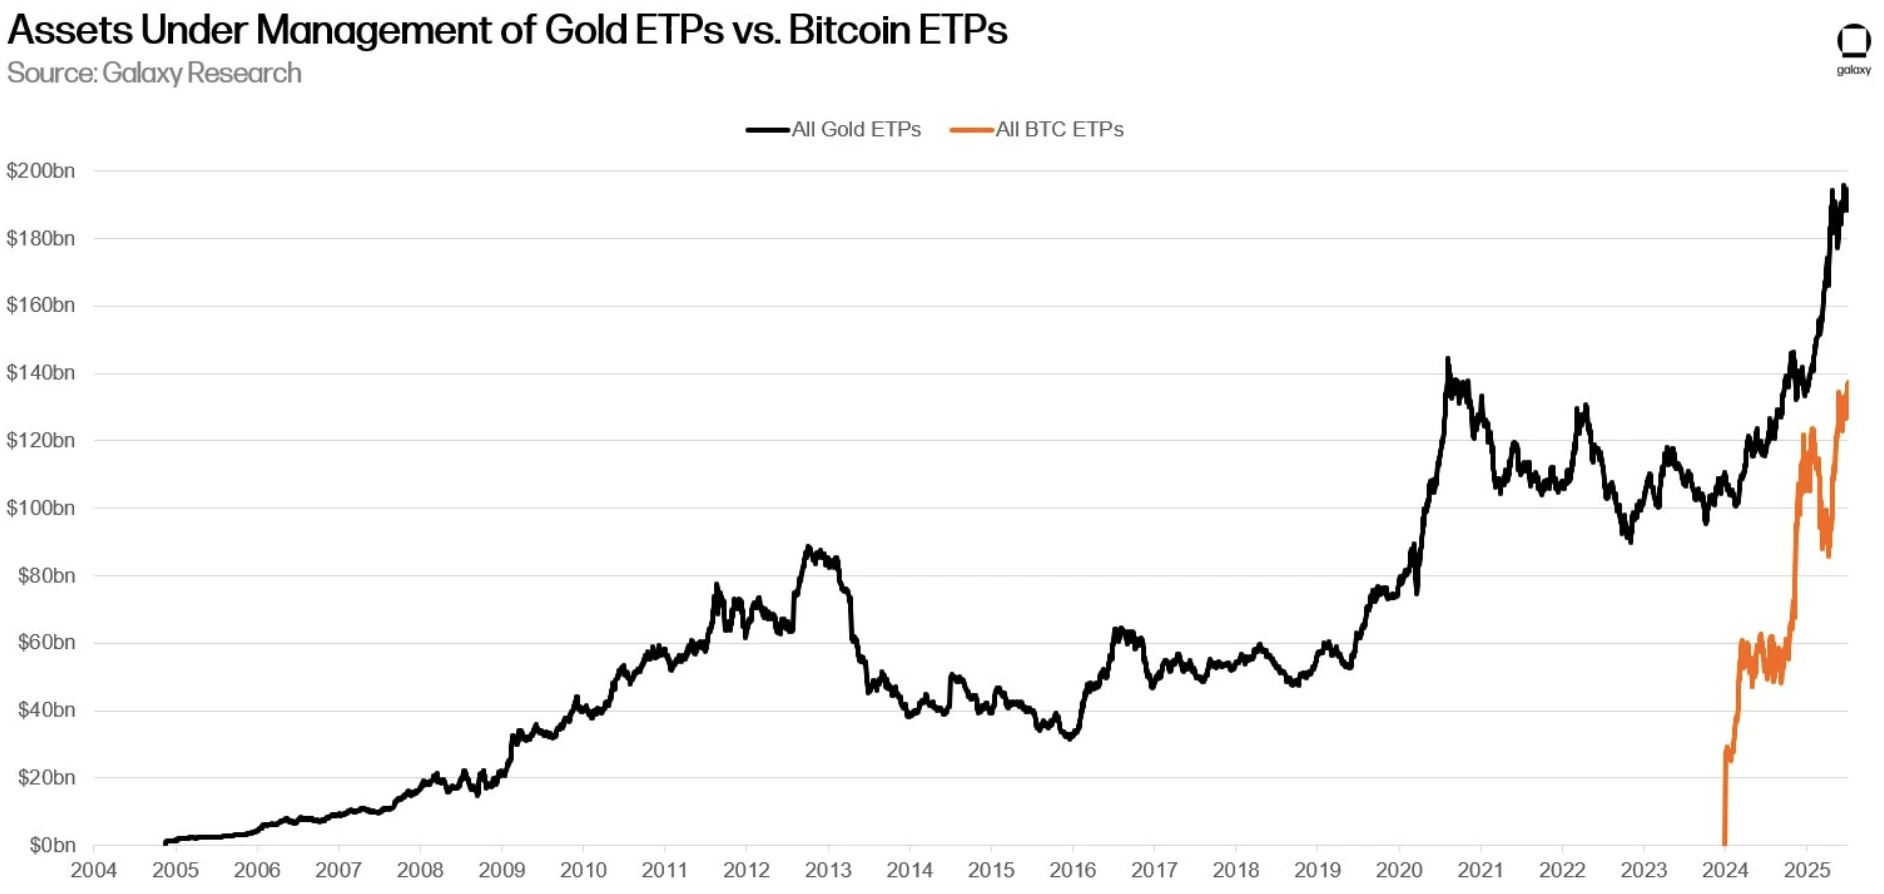
The numbers speak volumes. Bitcoin ETFs, only approved in early 2024 after years of regulatory wrangling, have already topped $150 billion in assets under management. For context, it took gold ETFs over 16 years to hit that same milestone. That kind of growth doesn’t happen unless big players are piling in.
Backing this up, a study in the Journal of Financial Economics shows that nearly 70% of institutional investors now see Bitcoin as a legitimate asset class. And in a notable pivot, JPMorgan analysts have turned bullish on BTC, now expecting it to outperform gold in the second half of the year. They’ve even described the trend as a “zero-sum game” - when gold slips, Bitcoin climbs. That’s a big deal in traditional finance circles.
From digital gold to political headlines
There’s another force at play - politics. Bitcoin is increasingly behaving like a geopolitical hedge. Following President Trump’s announcement of sweeping tariffs on countries like Malaysia and South Africa, Bitcoin didn’t flinch. In fact, it rallied - and has continued to decouple from equity markets on days the S&P 500 corrects.
That perception of Bitcoin as a safe haven is gathering steam, especially as fears over fiat debasement resurface. Analysts at Sygnum Bank say this shift is helping Bitcoin carve out a role traditionally held by gold, but with the added allure of digital innovation.
Crypto regulation news could garner more institutional interest
All this is happening against a surprisingly pro-crypto policy backdrop. The U.S. Congress is preparing to debate the Genius Act - a bill designed to bring stablecoin issuers under regulatory oversight. It’s been redrafted to address concerns around consumer protection and national security, and now appears to have bipartisan support.
Bo Hines, executive director of the president’s council of advisors for digital assets, bluntly stated during this week’s Consensus conference: “We’re ready for adoption. We are moving extremely quickly and effectively.”
The implication? If passed, this legislation could unlock a new wave of institutional interest, particularly from cautious players waiting for clearer regulatory guardrails.
Bitcoin price prediction: Is 120K next?
Technically, Bitcoin is flirting with the next psychological milestone. It’s already broken out of a tight trading range and is holding above previous resistance. If it can stay there, and macro conditions remain supportive, $120K could come into view faster than many expect.
That said, a word of caution: the IMF recently warned that crypto assets remain three times more volatile than traditional ones. And while ETF growth is impressive, some market watchers worry it could be distorting natural price action.
Still, with spot buyers in control, institutional appetite growing, and regulation moving from theory to reality, this rally feels more grounded than the last. It’s not just charts and candles anymore - it’s policy, portfolios, and purpose.
Bitcoin price outlook
Bitcoin’s latest breakout isn’t just a price move - it’s a signal. A signal that crypto is no longer the fringe bet it once was. The ecosystem is maturing, institutions are engaging, and regulators are finally playing ball.
$120K? It’s no longer a moonshot. It might just be the next logical step.
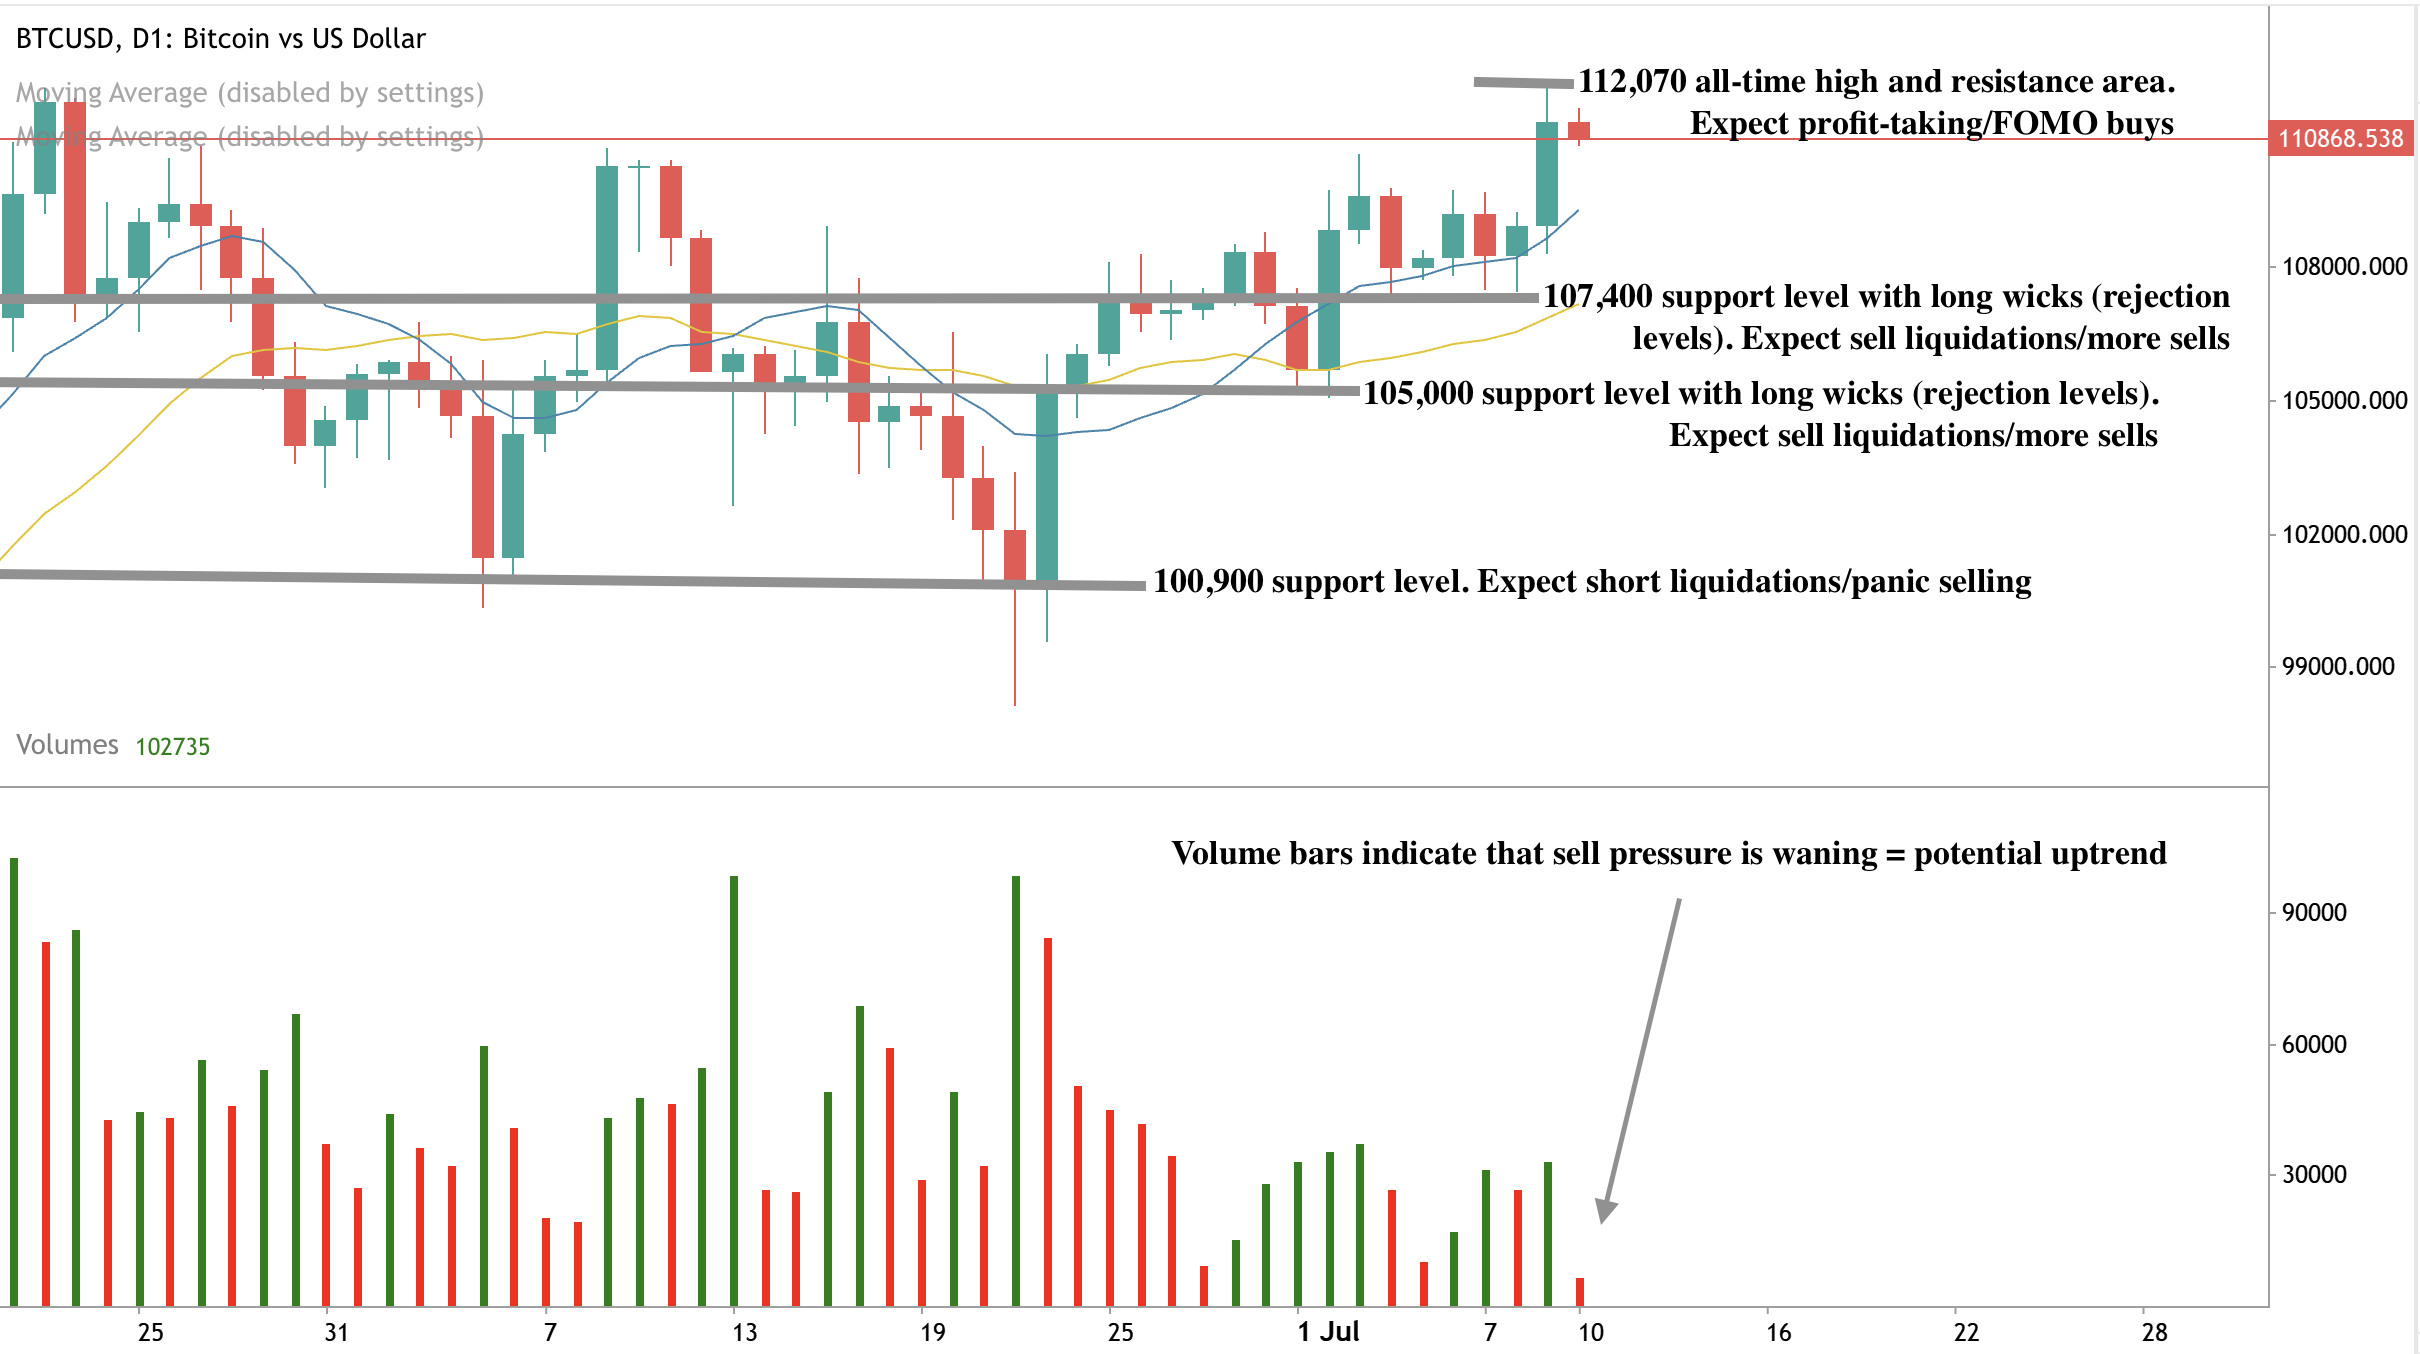
At the time of writing, Bitcoin is seeing some pullback from its all-time high, with clear signs of profit-taking. The volume bars, on the other hand, tell the story of dominant buy pressure over the past days, with sellers offering little resistance, hinting at a potential further uptick. If the uptick materialises, we could see buyers face resistance around the all-time highs. Conversely, if we see a slump, prices could be held at the $107,400 and $100,900 support levels.
Will Bitcoin race to 120K? You can speculate on the price of BTC with a Deriv MT5, Deriv cTrader, or a Deriv X account.
Trade shifting market volatility with Volatility Switch Indices
What if you could trade a synthetic index that doesn’t just move randomly, but shifts through distinct phases of market activity, much like real markets?
What if you could trade a synthetic index that doesn’t just move randomly, but shifts through distinct phases of market activity, much like real markets? That’s what Volatility Switch Indices (VSI) offer: a structured way to trade changing volatility, all within one instrument.
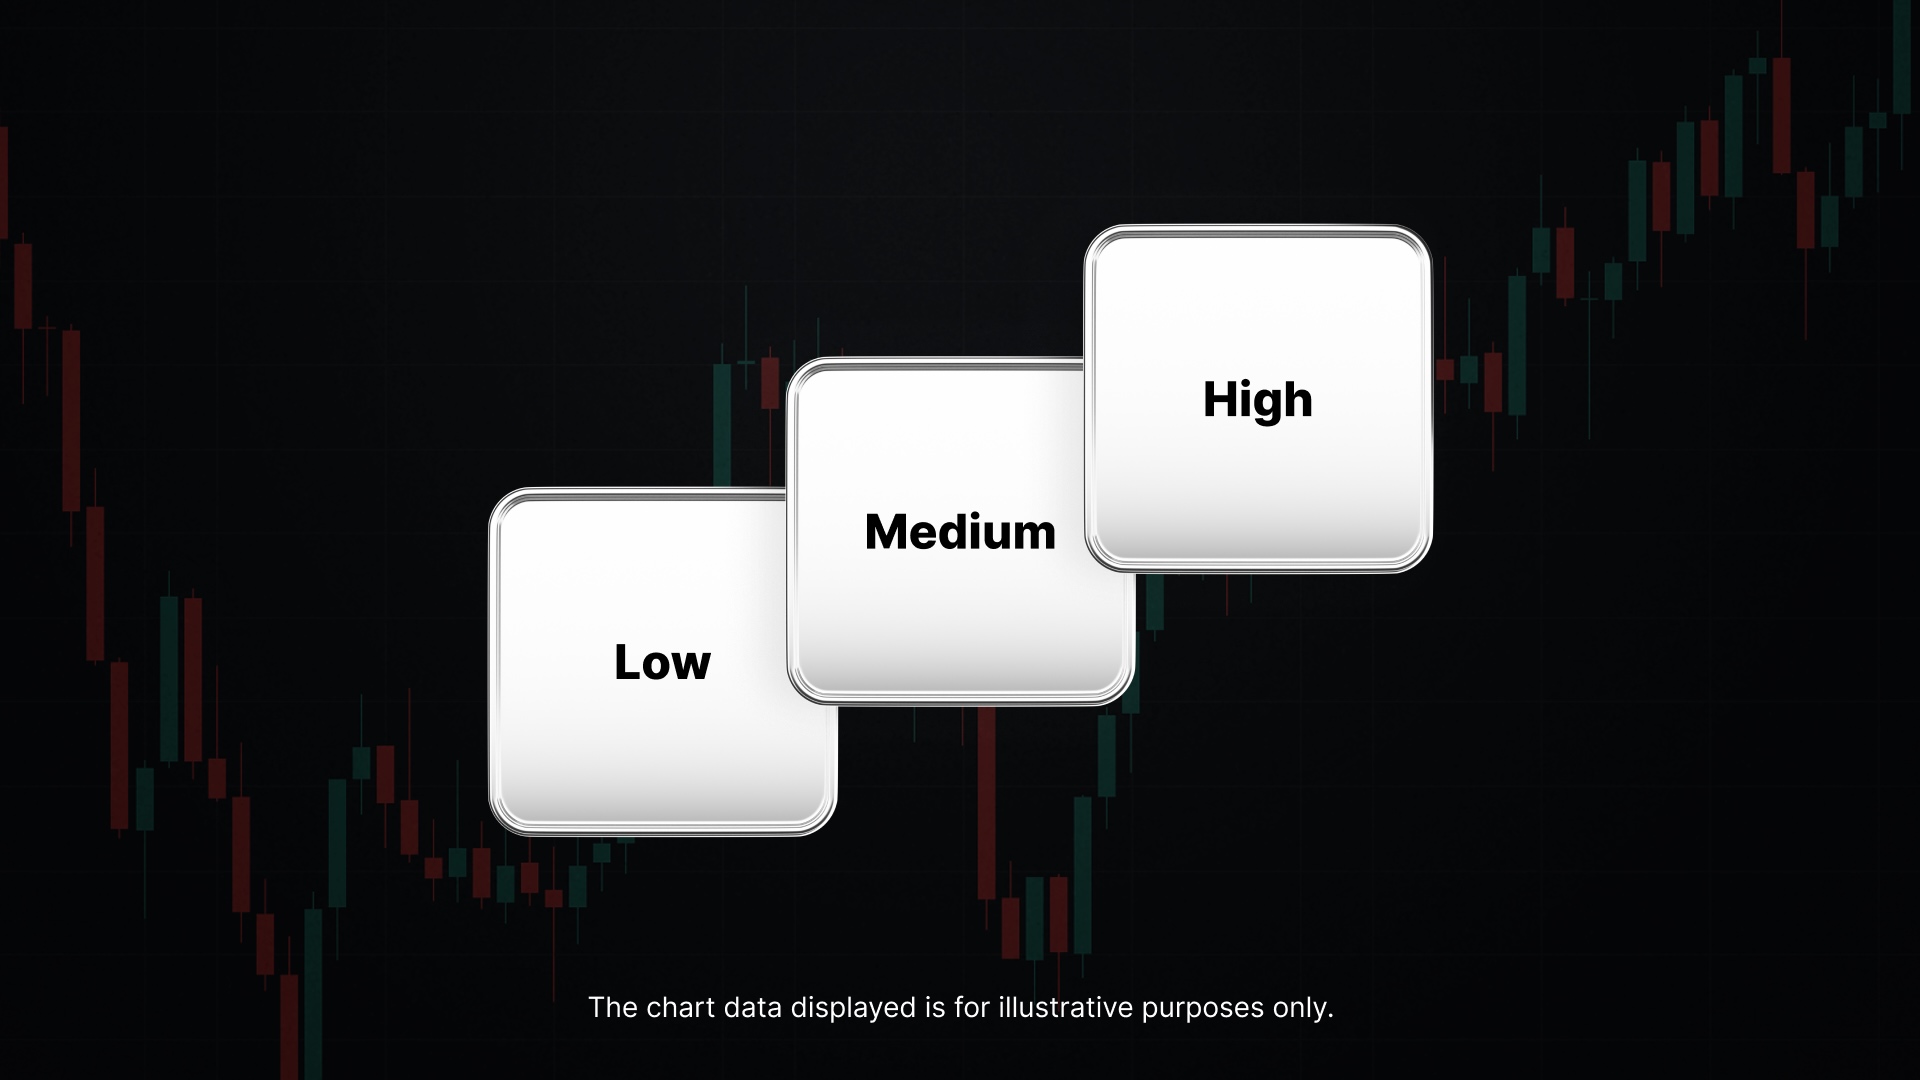
VSI is now available on Deriv, ready for you to explore. Each index cycles through low, medium, and high volatility phases in a continuous cycle, offering a dynamic and realistic synthetic market experience.
What makes Volatility Switch Indices different from trading other Synthetic Indices?
Most synthetic indices operate at a fixed volatility level or behave unpredictably. VSI introduces a structured cycle of changing conditions.
Each phase is defined by how much the index is expected to move with different levels of volatility:
- VSI Low: 10-25% volatility, with longer regime durations and steadier conditions
- VSI Medium: 50-100% volatility, offering a balanced mix of variability and pace
- VSI High: 100-200% volatility, with faster regime switching and more intense market behaviour
Rather than switching between indices to match changing market conditions, VSI gives you all three volatility phases in a single instrument.
Why traders should explore Volatility Switch Indices
Built for changing market behaviour, VSI allows traders to explore volatility trading strategies by offering:
- Predefined volatility regimes: Trade across low, medium, and high volatility phases — all within a single instrument
- Strategy flexibility: Adjust your strategy based on how volatility may evolve
- Dynamic spreads: Spread levels adjust based on the current volatility phase
- 24/7 availability: Trade any time, unaffected by real-world news or events
Start trading Volatility Switch Indices today
Volatility Switch Indices are now available for demo accounts on Deriv MT5 and Deriv cTrader.
Log in to your Deriv account and explore Volatility Switch Indices, or if you’re new to Deriv, sign up now to start trading.
Stable Spread Instruments bring clarity to your trading costs
With Stable Spread Instruments (SSI), managing your trading spread becomes more predictable even when market volatility rises. That means fewer surprises and more control when the markets move fast.
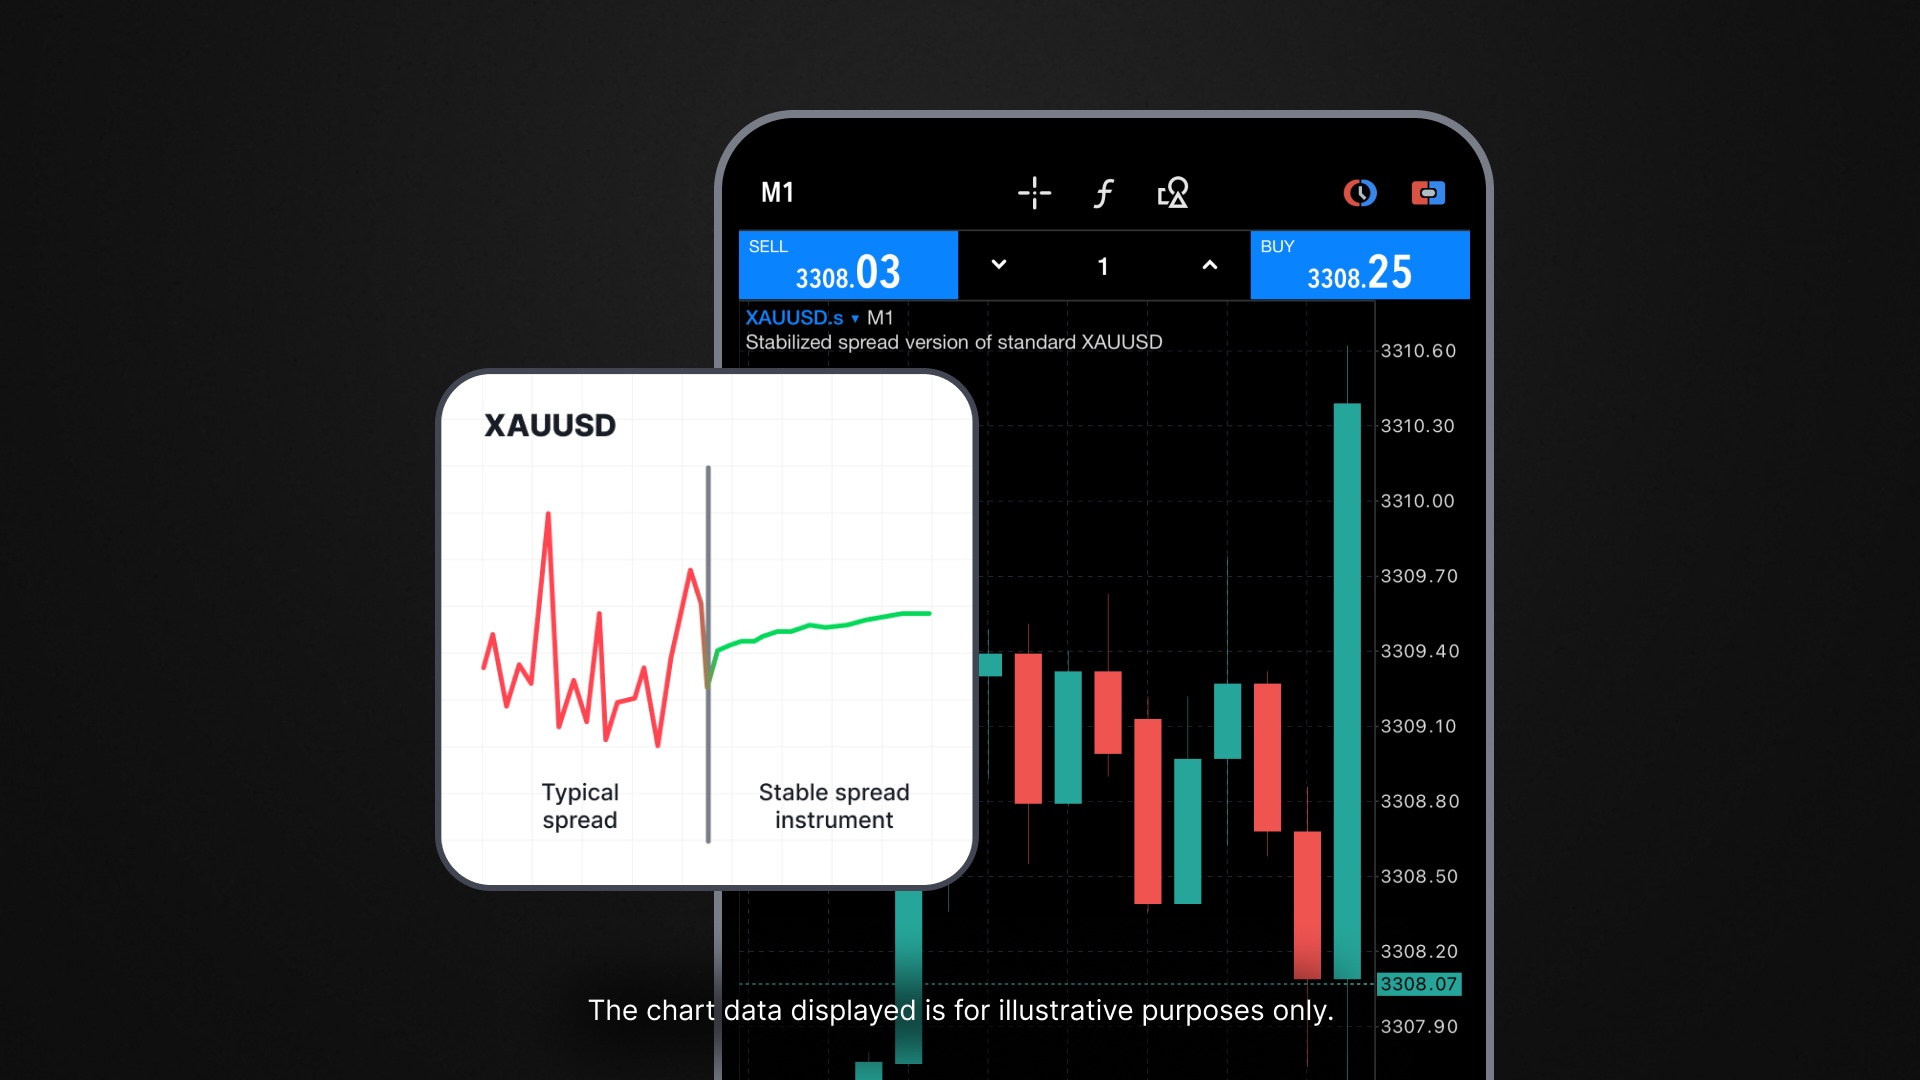
Picture this: You’re trading Gold or EUR/USD during a major news event. Normally, spreads might spike, raising your costs just when speed and timing matter most.
With Stable Spread Instruments (SSI), managing your trading spread becomes more predictable even when market volatility rises. That means fewer surprises and more control when the markets move fast.
What makes Stable Spread Instruments different?
Stable pricing gives traders better visibility into the spread in currency trading — helping you anticipate costs more effectively during volatile conditions. SSI supports this by aiming to keep spreads steady throughout the day.
Why traders should explore Stable Spread Instruments
Whether you're reacting to a move or setting up a longer trade, SSI offers consistent pricing that helps you reduce the impact of spread fluctuations, especially in fast-moving forex markets.
With SSI, you get:
- Spreads designed to stay consistent throughout the day
- Reduced spread spikes during fast or active markets
- Clearer visibility on entry and exit costs
- A steadier way to trade forex and metals — ideal for managing forex spread trading costs more consistently
Start trading Stable Spread Instruments today
Stable Spread Instruments are now available for demo accounts on Deriv MT5.
Log in to your Deriv account and explore Stable Spread Instruments, or if you’re new to Deriv, sign up now to start trading.

The copper price split may be just a blip
Copper’s having a moment - and not the kind you’d expect from a metal best known for quietly powering our homes, cars, and gadgets.
Copper’s having a moment - and not the kind you’d expect from a metal best known for quietly powering our homes, cars, and gadgets. Prices in the US have just shot to an all-time high, while markets in London and Shanghai seem to be shrugging it off.
In fact, copper is now trading at a jaw-dropping 25 percent premium in New York compared to the global benchmark. That’s not just unusual - it’s historic.
So, what’s going on? Is this a one-off market wobble triggered by tariff threats and trader panic? Or is copper flashing a warning light that something deeper is shifting in the global economy?
Let’s take a closer look at the split that’s got everyone from miners to manufacturers scrambling.
US copper tariffs: The spark behind the surge
It all started with a bold declaration. During a Cabinet meeting, former US President Donald Trump dropped a bombshell - plans to slap a 50 per cent tariff on copper imports. That single sentence sent markets into a frenzy.
Within hours, copper futures on the New York Comex surged by a record-breaking 17 percent, briefly hitting 5.89 dollars per pound - a level never seen before.
Meanwhile, in London, the mood was far less dramatic. Prices on the London Metal Exchange, which usually sets the tone for global copper trading, actually dipped 1.5 percent.
Shanghai’s market followed suit, leaving traders scratching their heads: Why is the US price flying solo?
A Copper market playing catch-up
Analysts note that copper doesn’t usually behave like this. It’s one of the most globally traded industrial metals, and pricing tends to stay relatively aligned across major exchanges. A small premium in one region? Sure. But 25 per cent? That’s like paying extra for a meal in New York because it might rain next week.
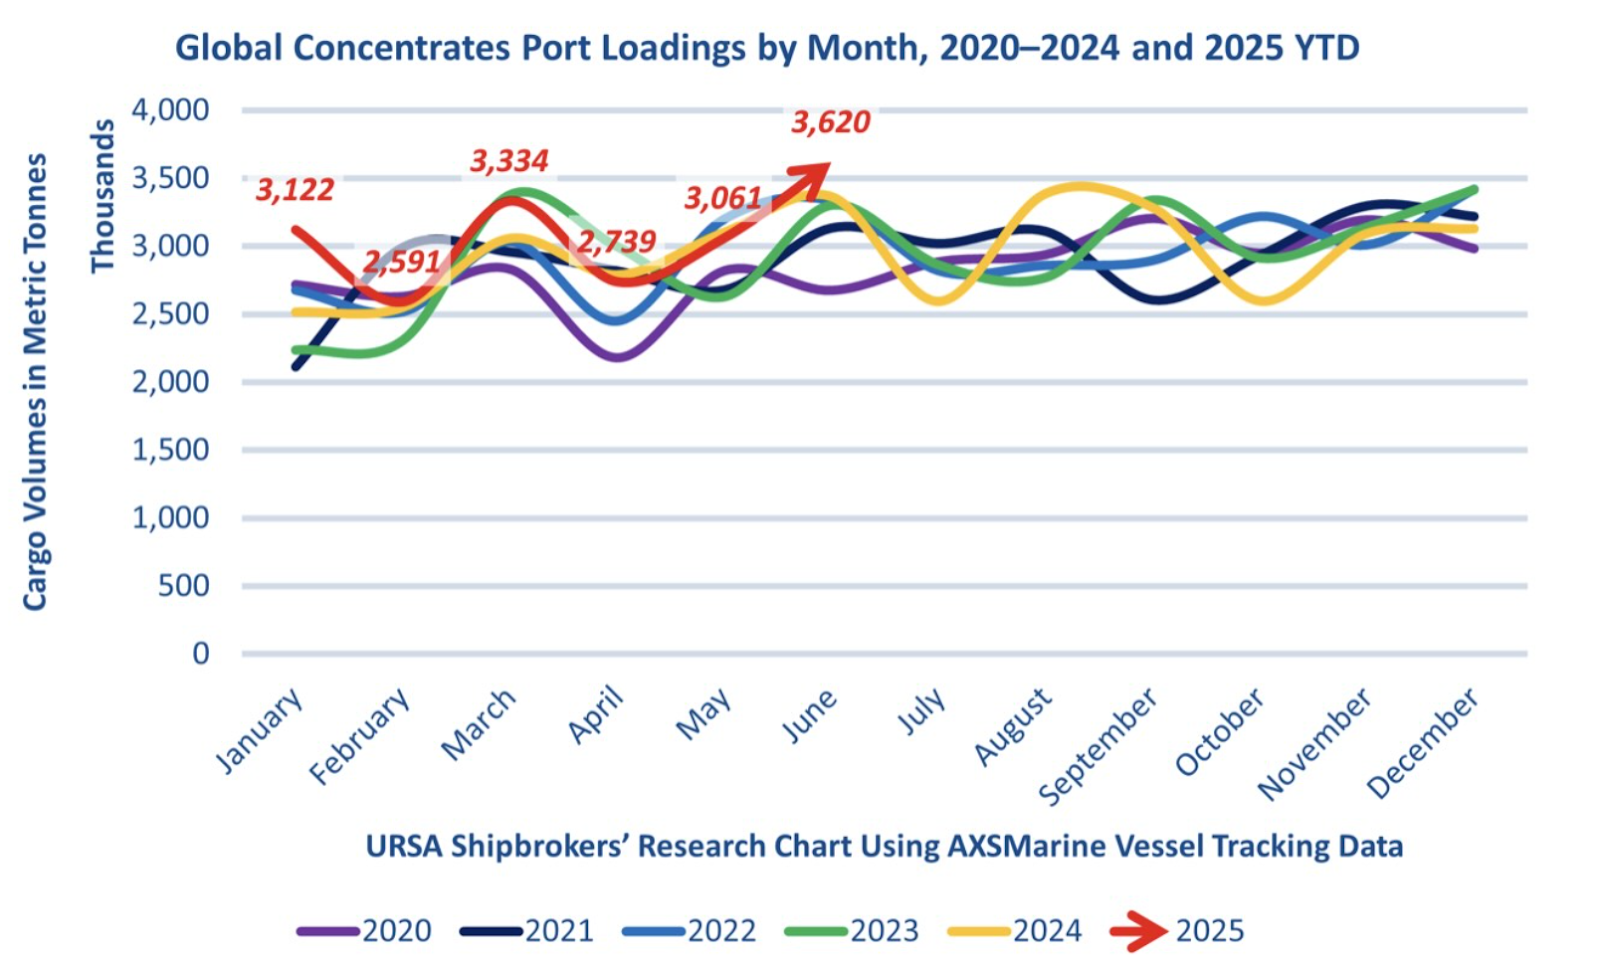
According to reports, tariff talk sparked a mad dash to stockpile copper in the US before prices climb even higher. Traders have been shipping record volumes into the country, hoping to beat the clock. And with fears of tighter supply, buyers are willing to pay more - a lot more - just to lock in what they can.
Copper market divergence: Blip or bigger problem?
Now, here’s the real question: Is this all temporary panic or the start of a long-term split in the copper market? Analysts are divided.
Some experts, including those at Morgan Stanley, believe the price surge could be short-lived. Once US inventories catch up and the market calms down, Comex prices may settle back into alignment. Traders hoarding copper now could find themselves sitting on expensive stock if demand doesn’t keep pace.
Others, however, see something more structural brewing. The US relies on imports for more than half of its refined copper, much of it coming from Chile, Canada, and Mexico.
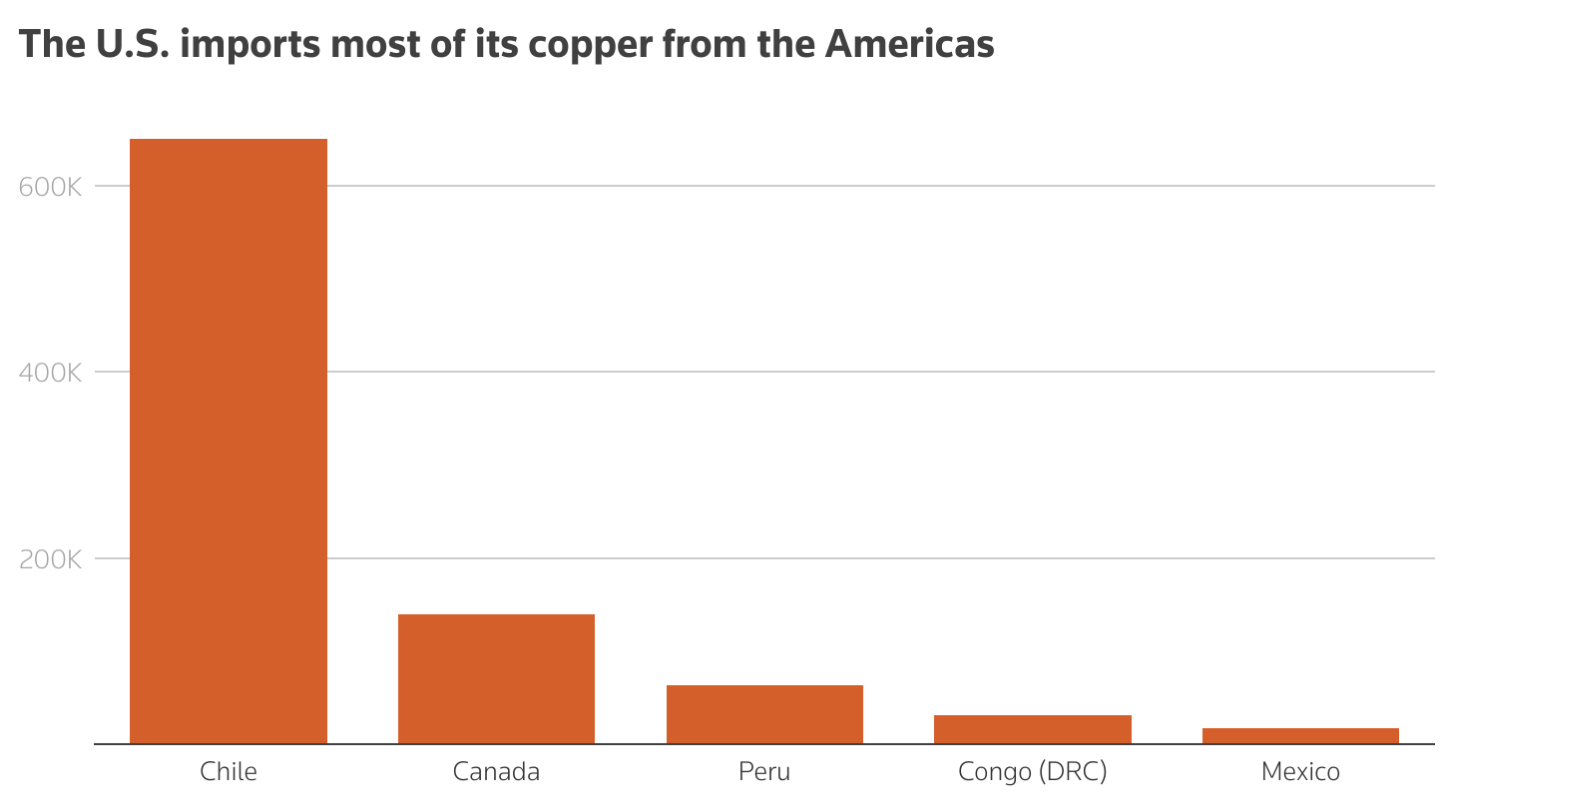
While America has rich copper reserves, it lacks the refining muscle to meet domestic demand. Tariffs might protect producers on paper, but they could just as easily saddle manufacturers with sky-high input costs. That’s hardly a recipe for industrial revival.
Why this matters more than you think
Copper isn’t just any old metal. It’s the lifeblood of the modern economy - and the green one we’re building. From electric vehicles and wind turbines to smartphones and data centres, copper is everywhere. If prices spiral in one region, it doesn’t just hit traders. It hits construction firms, automakers, and clean energy projects, too.
And there’s also the geopolitical ripple effect. If the US becomes a high-cost copper island, suppliers may start looking elsewhere, like China, for more stable and long-term trade relationships. In a world already feeling the strain of supply chain tensions, this price divergence could widen the gap even further.
So, where do copper prices go from here?
For now, there’s plenty of copper sitting in US warehouses, albeit at eye-watering prices. But the long-term picture remains murky. The market still doesn’t know when the tariffs will actually kick in, whether any products will be exempt, or if this divergence will force a deeper reshaping of global copper flows.
What’s clear is that markets don’t like uncertainty, and copper’s recent behaviour is a textbook example of what happens when policy, speculation, and supply chains collide.
Is the copper price split just a blip? Maybe. But if it is, it’s a blip with consequences. Because in today’s world, when a metal like copper breaks away from the pack, it’s rarely just about price - it’s about power, policy, and what comes next.
LME copper prices outlook
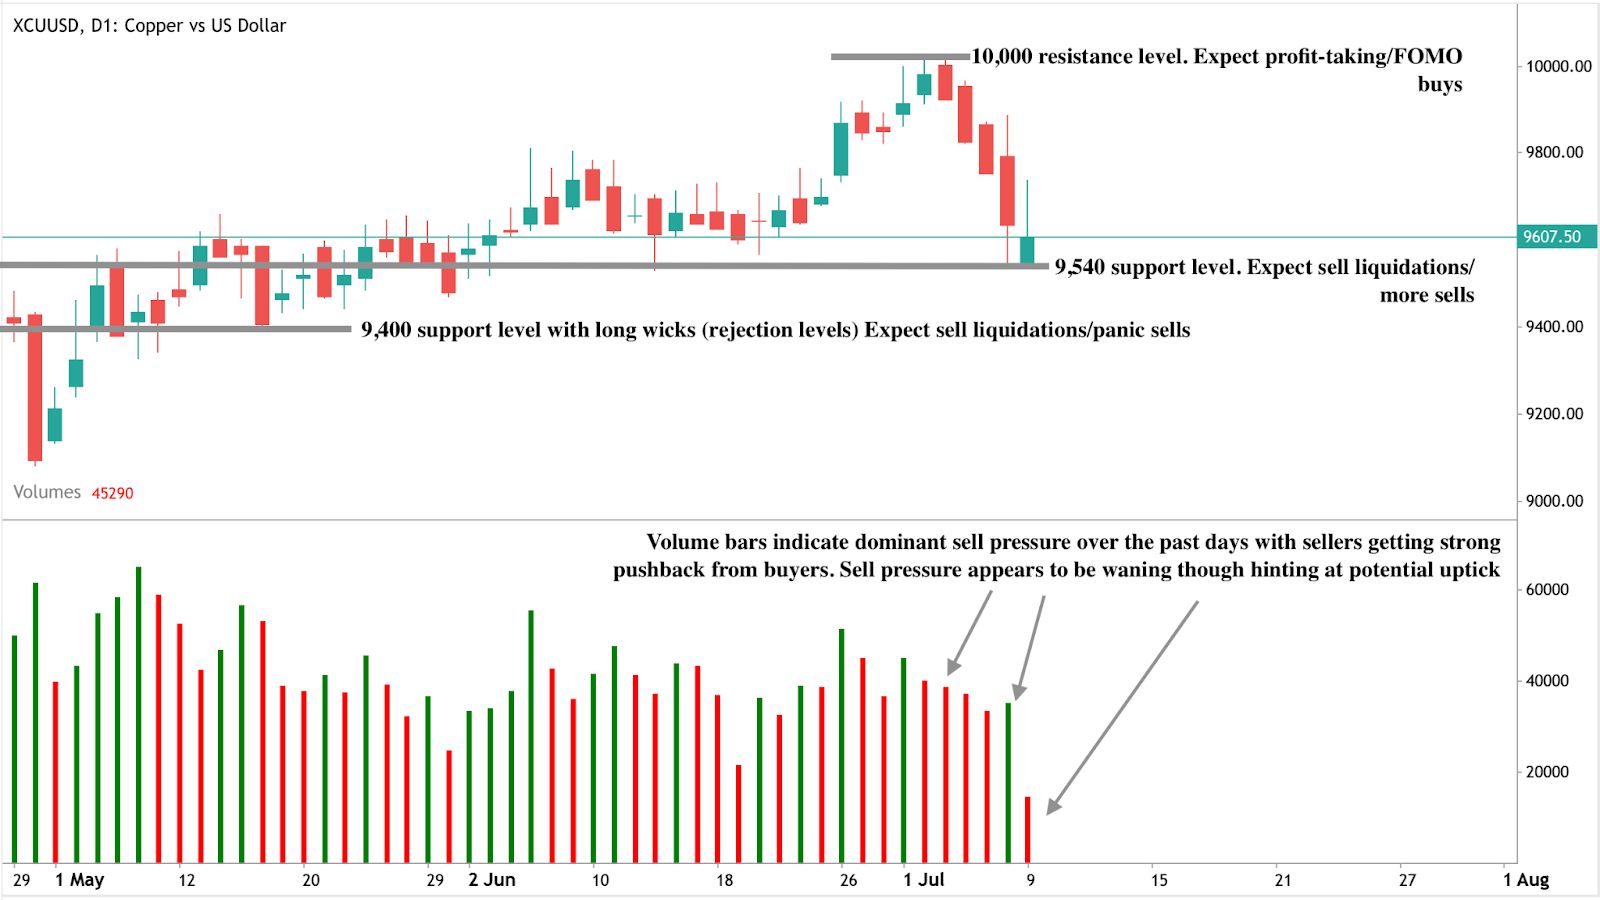
At the time of writing, Copper prices (LME) are under pressure with the latest green bar forming a massive wick, hinting at strong sell pressure. However, the volume bars indicate that sell pressure is waning, hinting that a move downwards could be curtailed. If a move downwards materialises, prices could find support at the $9,540 and $9,400 support levels. Conversely, if we see an uptick, prices could find resistance at the $10,000 price level.
Is buying the dip the best strategy in 2025?
With the S&P 500 at record highs and tech stocks like Nvidia bouncing back stronger after every fall, one question keeps coming up: is buying the dip not just working 0 but winning?
So far in 2025, what looks like market chaos has actually been a goldmine - at least for the brave. Every wobble, every sharp drop, every so-called “bloodbath” has turned into a buying opportunity. And those who dared to dive in? They’re laughing all the way to the bank.
With the S&P 500 at record highs and tech stocks like Nvidia bouncing back stronger after every fall, one question keeps coming up: is buying the dip not just working 0 but winning?
Nasdaq record highs
Let’s start with the numbers. According to analysts, if you’d simply bought the Nasdaq 100 every time it had a down day this year, you’d be up roughly 32% - the best result for that strategy in five years. For context, this time last year, that return sat at a modest 5%.
The pace we’re seeing now puts 2025 on track to become the best year for dip-buying since at least 1985. Yes, even better than the bubbly days of 1999.
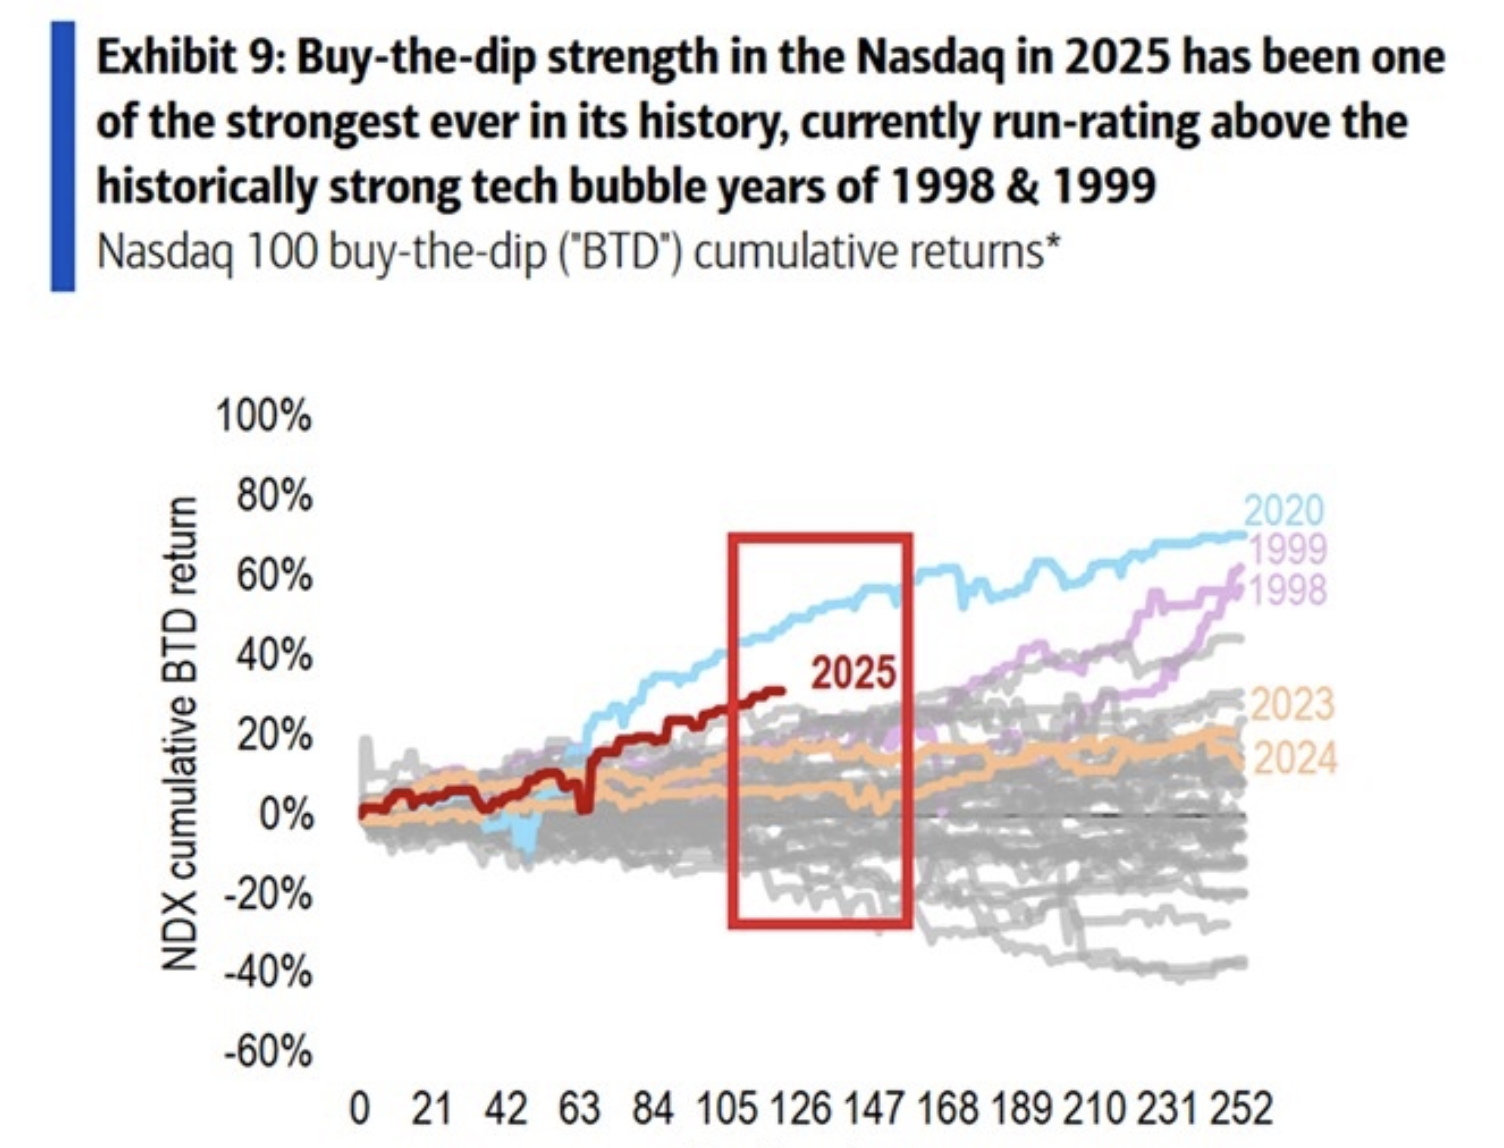
And it’s not like this has been a calm ride either. Out of the 124 trading days so far, the Nasdaq’s been down in 51 of them. That’s a whole lot of red candles - but also a whole lot of green rebounds.
Nvidia stock dips harder - and snaps back faster
If the market as a whole has rewarded dip-buyers, Nvidia has practically crowned them royalty.
The AI darling kicked off the year under pressure from China’s DeepSeek, a cheaper challenger in the machine-learning space. Then came the meltdown: on 27 January, Nvidia logged its worst-ever single-day drop - a brutal 17% fall. Ouch.
But that pain didn’t last. By early February, the stock had bounced back 20% heading into earnings. It wasn’t a one-off either. In April, Nvidia followed the market lower again, this time on fears surrounding Trump’s proposed tariffs. Shares tumbled 33% to their lowest point of the year.
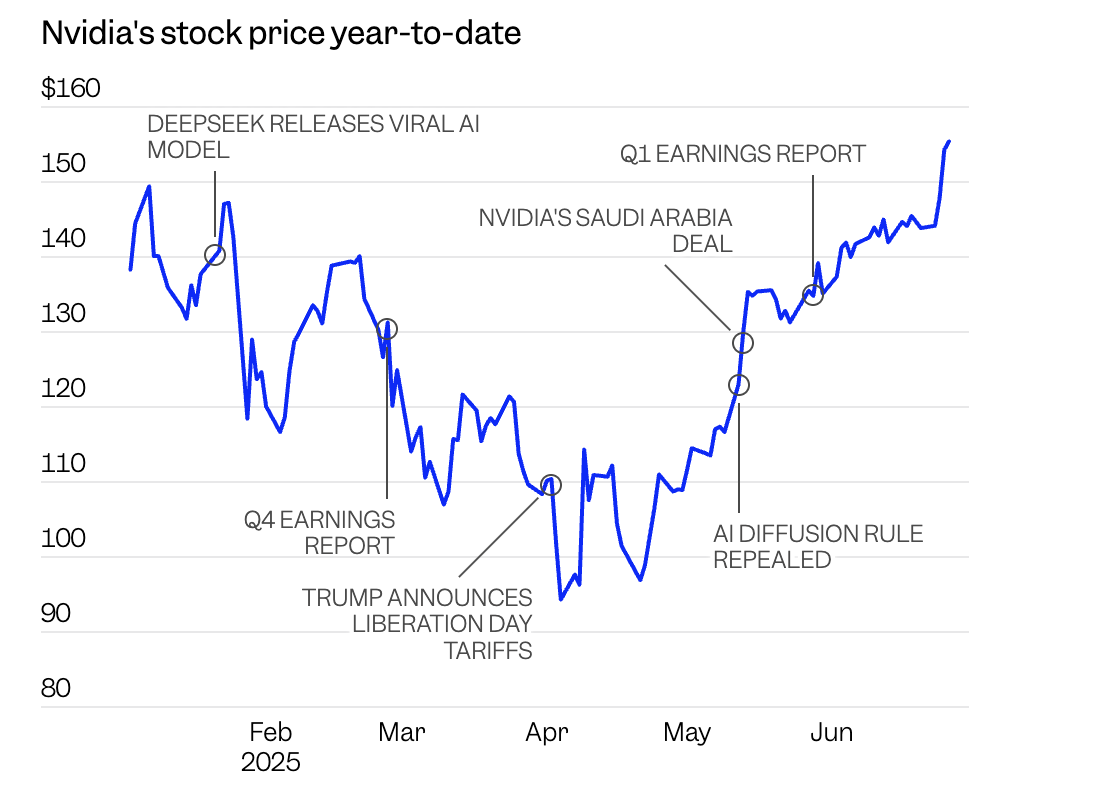
And then, you guessed it, another rally. A steep, unapologetic one. Since bottoming out, Nvidia has gone on to set new record highs, with shares rising 12% in just the past month. It’s been a dream for traders with the stomach for sharp drops and the conviction to hold through them.
Nvidia keeps hitting the Wall Street news
This isn’t just retail traders on Reddit throwing darts. Wall Street is increasingly convinced Nvidia’s dip-buying window is more than just luck.
Citi recently raised its price target to $190, suggesting a further 15% upside from current levels. One firm went even bolder, pegging a target at $250 - a price that would value Nvidia at a mind-bending $6 trillion.
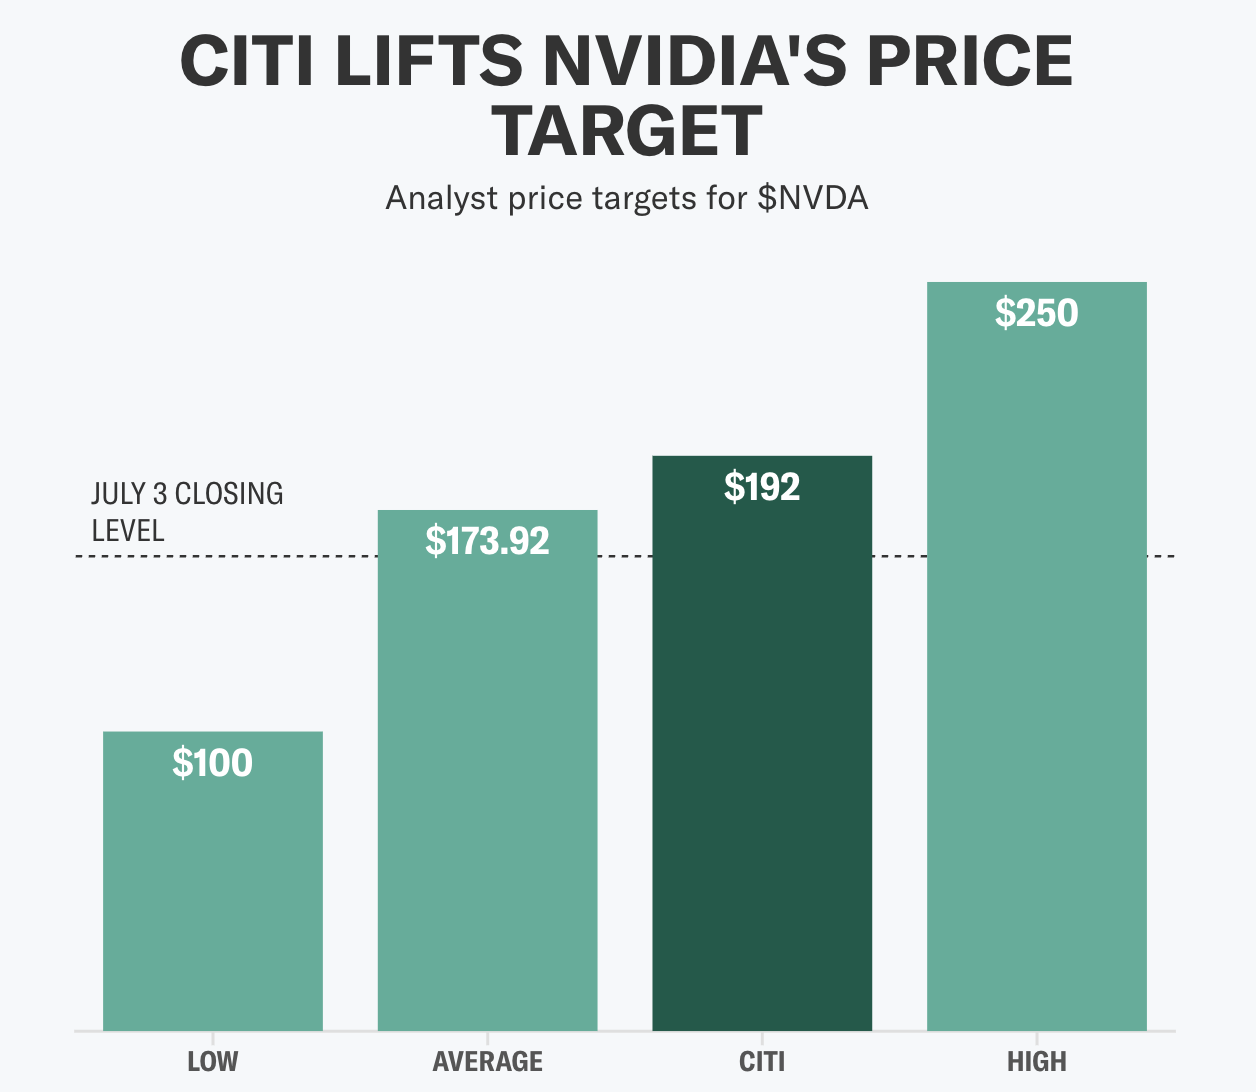
Why the enthusiasm? Simple: governments are buying AI infrastructure like it’s the new electricity. Citi’s analysts say sovereign demand alone could already be contributing billions of dollars in revenue this year. They expect it to ramp up even more in 2026.
The AI gold rush is real
At Nvidia’s recent generative AI conference, insiders floated a potential benchmark for national AI infrastructure: one supercomputer or 10,000 GPUs per 100,000 government employees. Think about that. That kind of buildout could keep Nvidia busy - and profitable - for years.
The company’s Blackwell GB200 chips are already powering most of these projects, and Citi believes the rollout is only accelerating. Supply chain concerns? Largely resolved. Rack buildouts? “Happening at a rapid pace.” Even the transition to next-gen GB300 chips is expected to be smooth, thanks to lessons learned from previous launches.
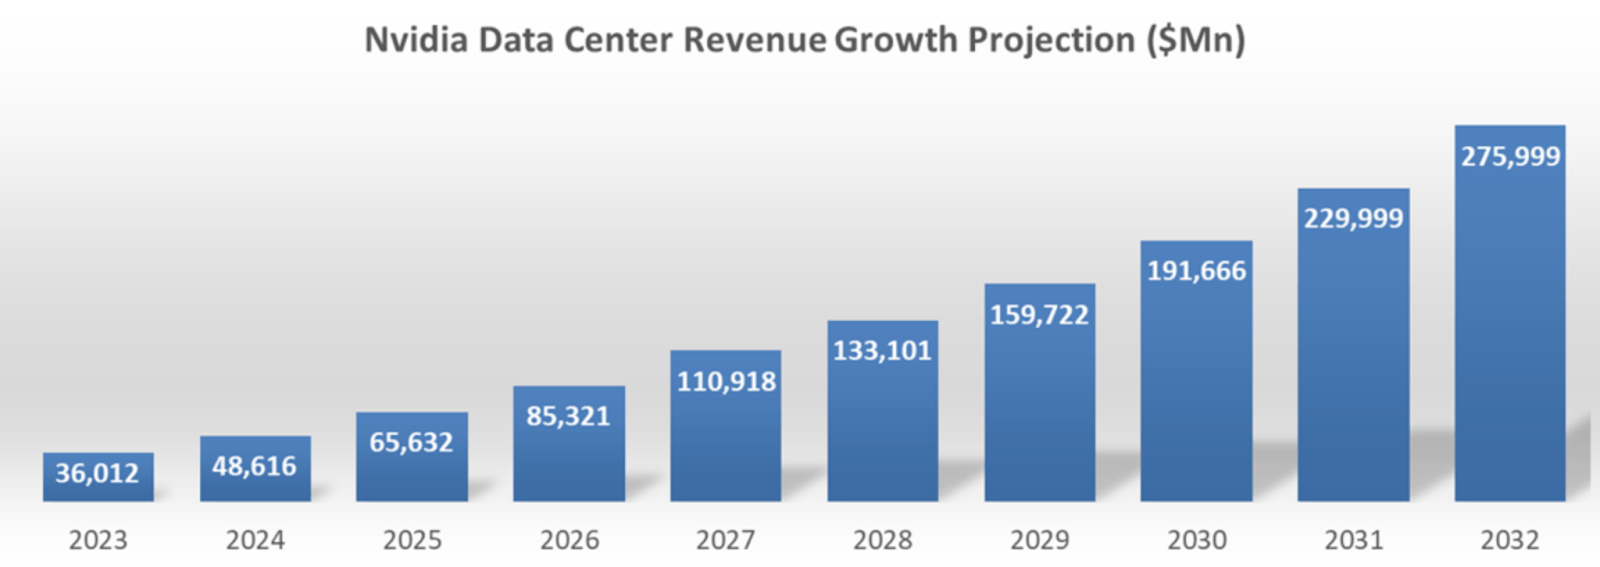
Global AI arms race: Green lights, with a hint of risk
Citi now expects Nvidia’s data centre revenue to rise 5% in FY 2027 and 11% in FY 2028, with networking sales surging even faster. Margins are expected to stabilise in the mid-70% range, which is excellent for a company scaling at this pace.
That said, there are still clouds on the horizon. Trump’s administration could reintroduce export restrictions - particularly with scrutiny on Malaysia and Thailand for possible indirect shipments to China. Regulatory risks remain real, especially for a company at the heart of a global AI arms race.
Dollar-cost averaging vs timing/buying the dip
If your timing’s been good this year, it’s not even close - buying the dip has been a beast. The market’s bouncing back with a vengeance, and Nvidia’s chart looks more like a trampoline than a trendline. Add in soaring demand, bullish analyst upgrades, and a possible sprint to a $4 trillion market cap, and it’s easy to see why traders are so confident.
But here’s the unfortunate twist, a Vanguard study analyzing 90 years of S&P 500 data, revealing that even perfect market timing to "buy the dip" underperformed dollar-cost averaging (DCA), challenging the common investor belief that timing dips maximises returns
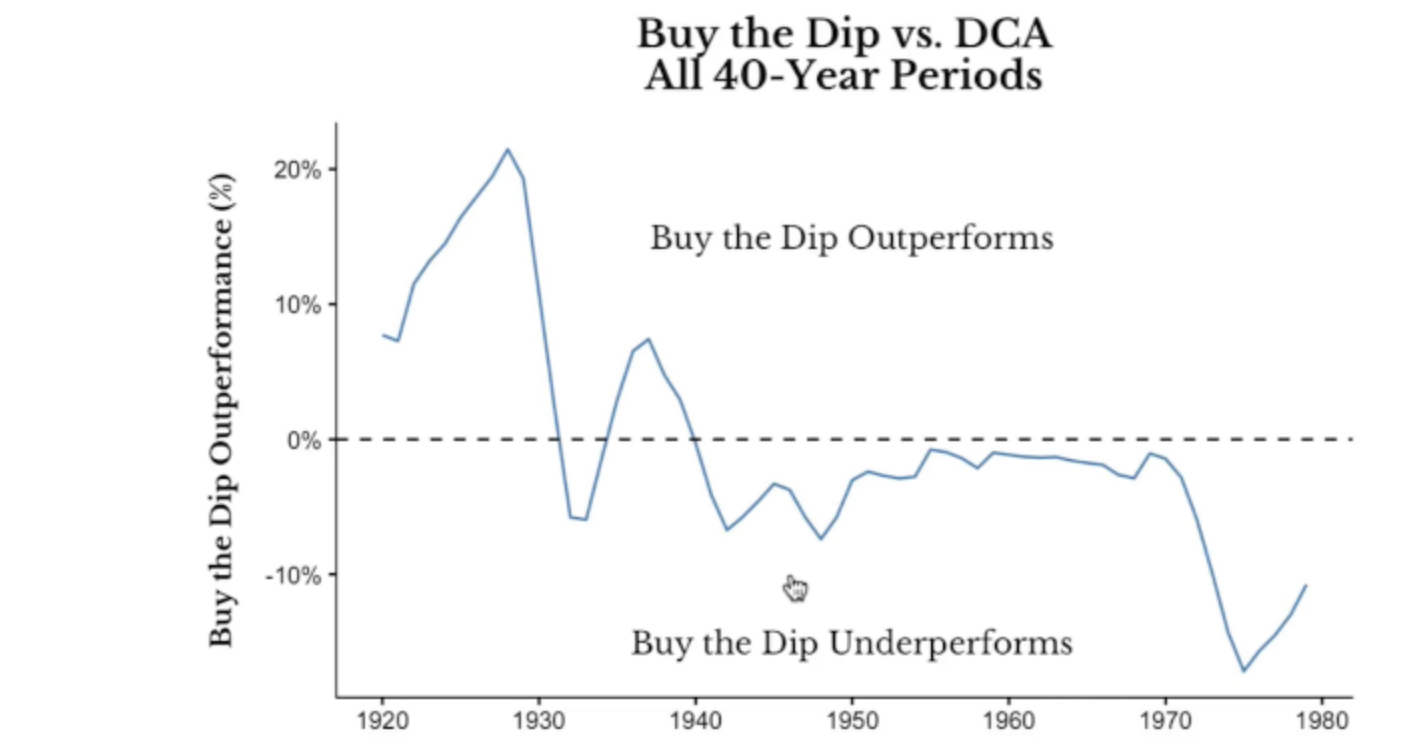
So, in a 2025 where buying the dip and holding your ground, especially with stocks like Nvidia, has rewarded you. the market’s been more than happy to reward you - the strategy has shown vulnerabilty in the long-term.
But as far as 2025 is concerned, volatility hasn’t been the enemy this year - it’s been the opportunity.
Nvidia outlook
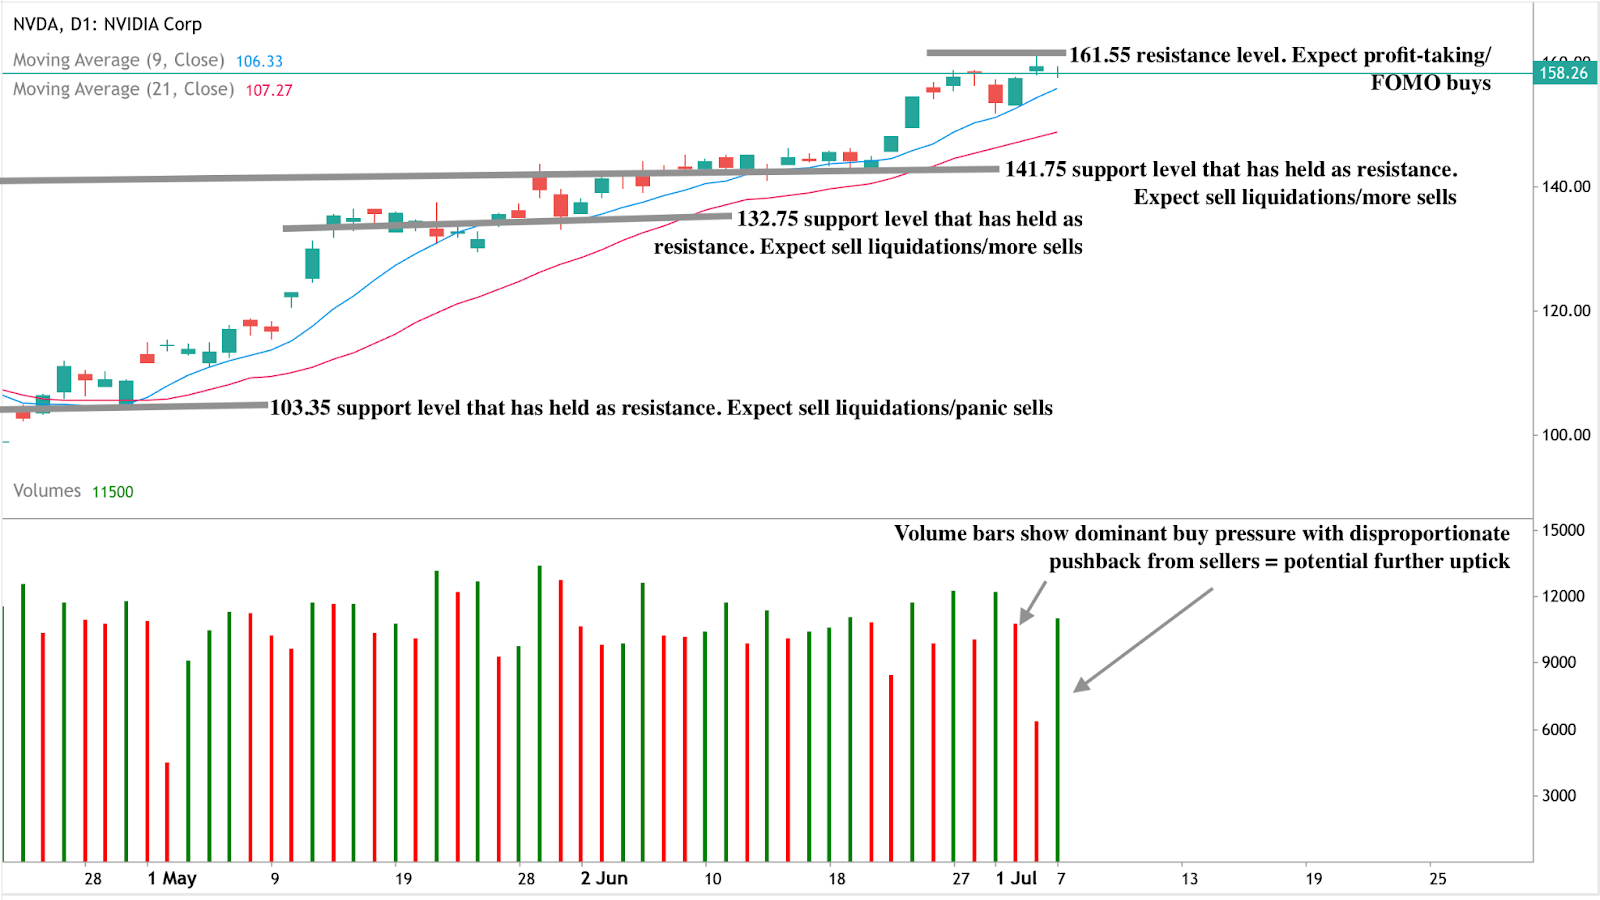
At the time of writing, Nvidia is showing signs of buy-side exhaustion after a significant rally, hinting at a potential reversal. However, the volume bars show that dominant buy pressure over the past few days has been met by disproportionate sell-side pushback, hinting that an upside move could still be on.
If we see an uptick, prices could encounter resistance at the $161.55 resistance level. Conversely, if we see a slump, prices could find support floors at the $141.75, $132.75, and $103.35 support levels.
Is trading Nvidia dips a potential winning strategy? You can speculate on Nvidia’s price trajectory with a Deriv MT5 account.
Bitcoin’s institutional demand could trigger the next big rally
With public companies scooping up coins faster than ETFs and political heavyweights like Elon Musk making pro-Bitcoin noise, the original crypto is having a serious glow-up.
Once the rebellious outsider of the financial world, Bitcoin is now rubbing shoulders with the suits. With public companies scooping up coins faster than ETFs and political heavyweights like Elon Musk making pro-Bitcoin noise, the original crypto is having a serious glow-up.
From Wall Street boardrooms to Capitol Hill spats, Bitcoin is no longer just a decentralised experiment - it’s becoming a power play. But with massive inflows, mounting debt, and a bit of political theatre in the mix, the big question now is: could this new wave of corporate and political clout spark the next major rally?
Bitcoin ETF inflows are back - and it's not what you think
In the second quarter of 2025 alone, public companies purchased a staggering 131,355 Bitcoins, boosting their holdings by 18%, according to Bitcoin Treasuries. ETFs weren’t far behind, adding 111,411 BTC - up 8% over the same period.
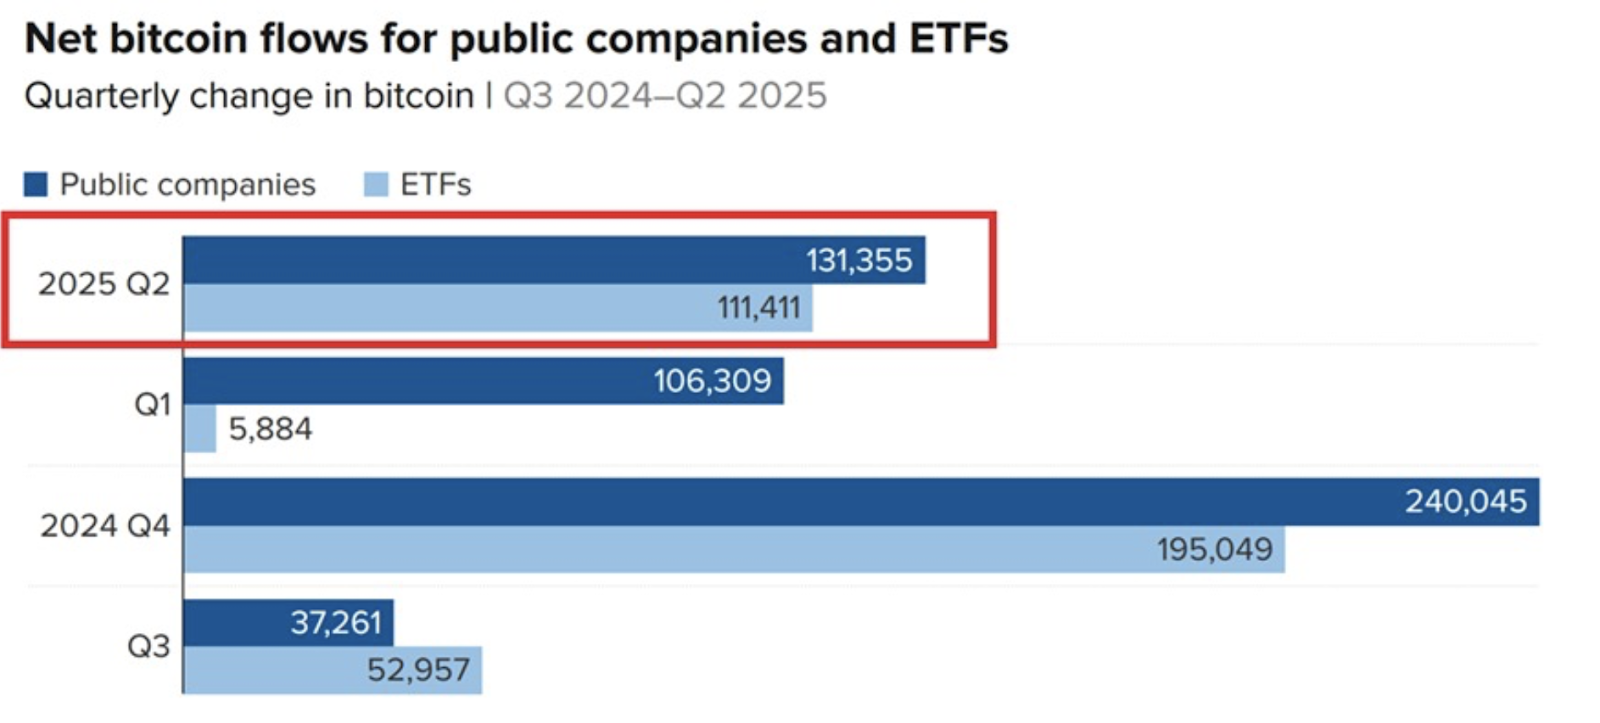
But here’s the twist: this is the third quarter in a row that public companies have out-bought ETFs. Year to date, companies have gobbled up 237,664 BTC, nearly double the amount acquired by ETFs. All in all, corporates now hold around 855,000 Bitcoins or roughly 4% of the total supply.
In other words, this isn’t just a Wall Street story - it’s a full-blown boardroom binge. Bitcoin is no longer a fringe hedge. It’s becoming a balance sheet asset.
Politics gets messy as Bitcoin news rides along
Enter Elon Musk, never one to shy away from a headline. After falling out with Donald Trump over what he dubbed a fiscally reckless “one big, beautiful bill,” Musk launched his own political movement - the “America Party.” At the heart of it? Ballooning U.S. debt and the belief that Bitcoin might just be the last line of defence.
Musk isn’t alone. Wall Street analysts and podcasters alike are sounding the alarm over the $37 trillion U.S. debt mountain, which is growing even faster thanks to new spending legislation that adds another $3 trillion to the tab and raises the debt ceiling by $5 trillion.
Musk and others’ message is clear: if the U.S. keeps printing and spending, the dollar risks losing credibility, and Bitcoin might be the “hard money” hedge that saves the day.
The bull case builds even as the Bitcoin price drops
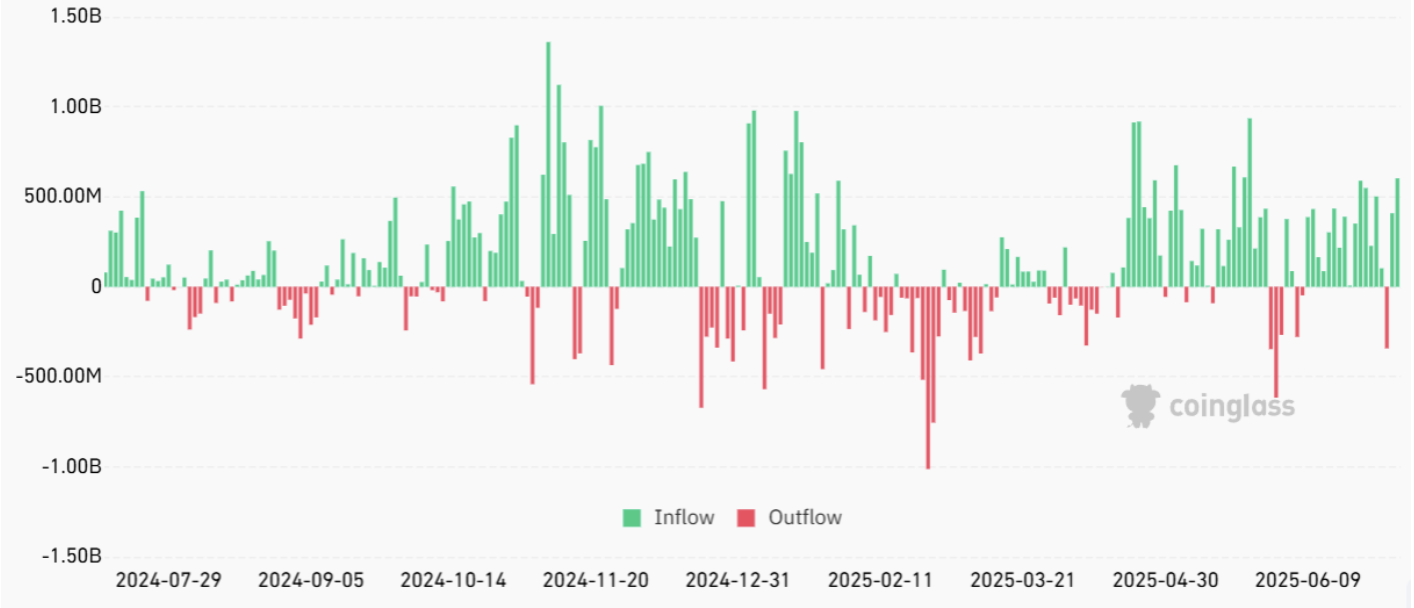
Now here’s where it gets interesting. Despite all this bullish momentum, institutional buying, political attention, and Wall Street product launches, Bitcoin’s price dropped to around $107,000, even after a $1 billion ETF inflow over two days.
That’s not how the script was supposed to go.
Analysts blame a mix of profit-taking, macro uncertainty, and regulatory jitters for the price dip. It’s a stark reminder that in crypto, narratives are powerful, but they don’t always move the price when you expect them to. ETF inflows are bullish, yes - but they’re not a magic wand.
Altcoin season indicators: Spotlight on Ethereum and Solana
While Bitcoin consolidates, the rest of the crypto market isn’t sitting still. Ethereum ETFs are quietly stacking up inflows, with $148.5 million added on Thursday alone - $85.4 million of that going into BlackRock’s ETHA fund. Since launching in July 2024, these Ethereum funds have attracted $4.4 billion.
Even Solana is getting its institutional moment, thanks to a brand-new staking ETF from REX Shares and Osprey Funds. It debuted this week with strong $11.4 million in day-one inflows, which is not bad for a token that was once written off as a meme chain with outages.
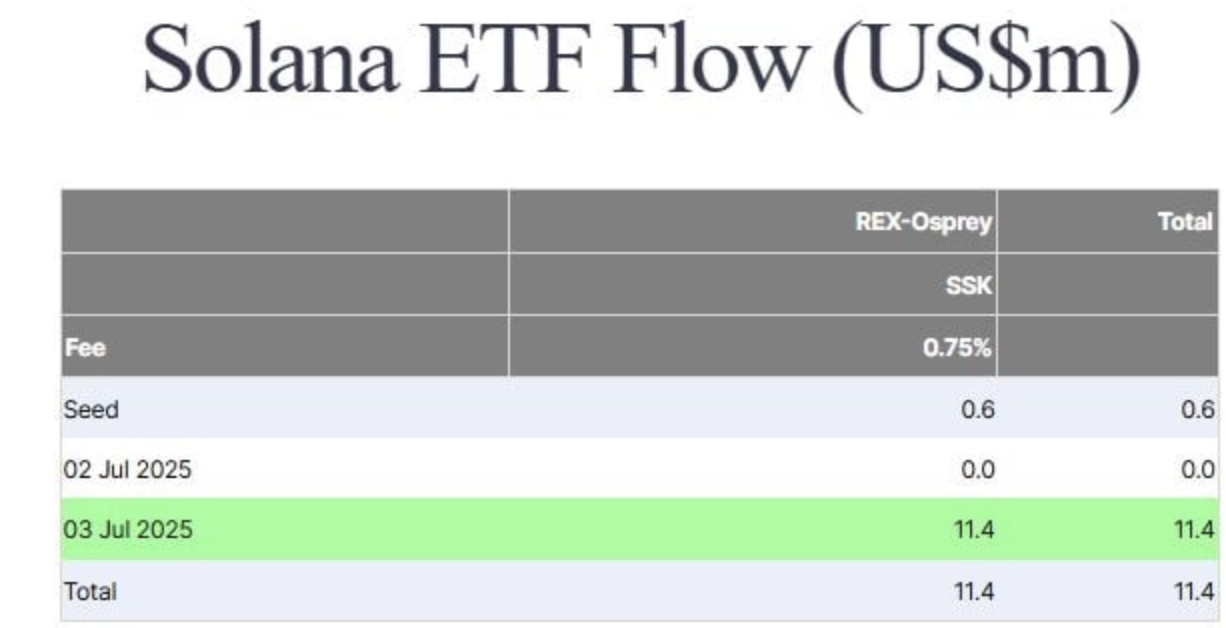
The takeaway? Institutions are no longer just banking on Bitcoin. They’re building crypto portfolios - and that could be huge for altcoins in the coming months.
The Altseason season setup is taking shape
Bitcoin dominance has climbed to 64.6%, which, if you’ve been around long enough, you’ll know is a level that often signals a shift. When BTC dominance peaks and starts to roll over, that’s when altcoins historically shine. It’s like a pressure valve releasing capital across the crypto landscape.
As BRN Research Analyst Valentin Fournier puts it: if Bitcoin consolidates near its highs, it could pave the way for a full-blown altseason. That means Ethereum, Solana, and even some of the usual meme suspects could get their moment in the sun - fuelled by both institutional inflows and good old retail FOMO.
Does this potential Bitcoin transformation mean take off?
Here’s the million-pound question: will Bitcoin’s new suit-and-tie persona finally deliver the rocket-fuelled rally investors are hoping for?
There’s a strong case for it:
- Institutions are all-in with ETFs nearing $50 billion in cumulative inflows.
- Corporate buyers are stacking sats like it’s a treasury strategy.
- Politicians are name-dropping Bitcoin amid a fiscal credibility crisis.
- And yet, the price wobbles - reminding everyone this is still crypto.
The glow-up is undeniable. Bitcoin has gone from a rebellious outsider to a respected asset class. But whether that transformation triggers the next major rally depends on one thing: what the market chooses to believe next.
Bitcoin price outlook
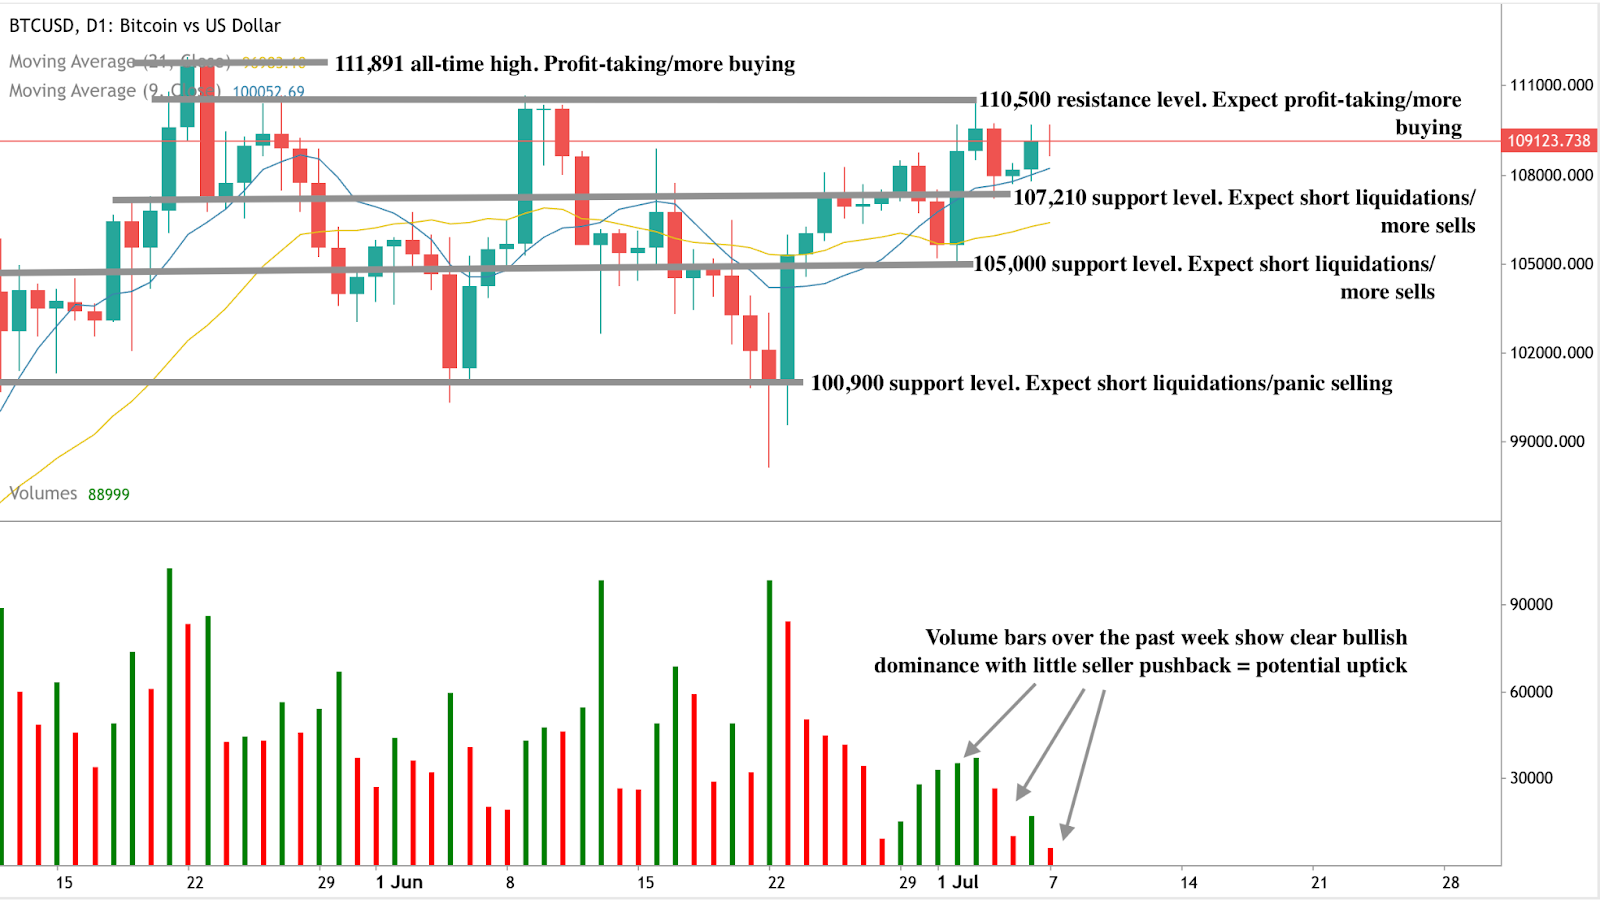
At the time of writing, Bitcoin is showing some buy pressure within a sell zone, hinting that the sellers could swoop in strongly at any time. However, the volume bars have shown bullish dominance over the past few days with little pushback from sellers, hinting at a potential uptick. If we see a price uptick, bulls could encounter resistance at the $110,500 and $111,891 price levels. Conversely, if we see a drawdown, sellers could find support at the $107,210, $105,000, and $100,900 support levels.

Is the S&P 500 rally living on borrowed time?
The stock market’s on a high again. On the surface, it all looks bulletproof. But peek behind the curtain and a different story emerges.
The stock market’s on a high again. The S&P 500 is smashing records, tech stocks are flying, and a surprisingly strong jobs report has traders feeling rather chipper. On the surface, it all looks bulletproof. But peek behind the curtain and a different story emerges: foreign investors are quietly hedging against the dollar, the Fed’s sitting on its hands, and America’s spending spree shows no signs of slowing down.
So, what gives? Is this the start of a new bull market, or are we dancing a little too close to the edge?
The rally that’s ignoring fed signals
Let’s start with the good news - June’s jobs report was better than expected, adding 147,000 new roles and bringing the unemployment rate down to 4.1%.
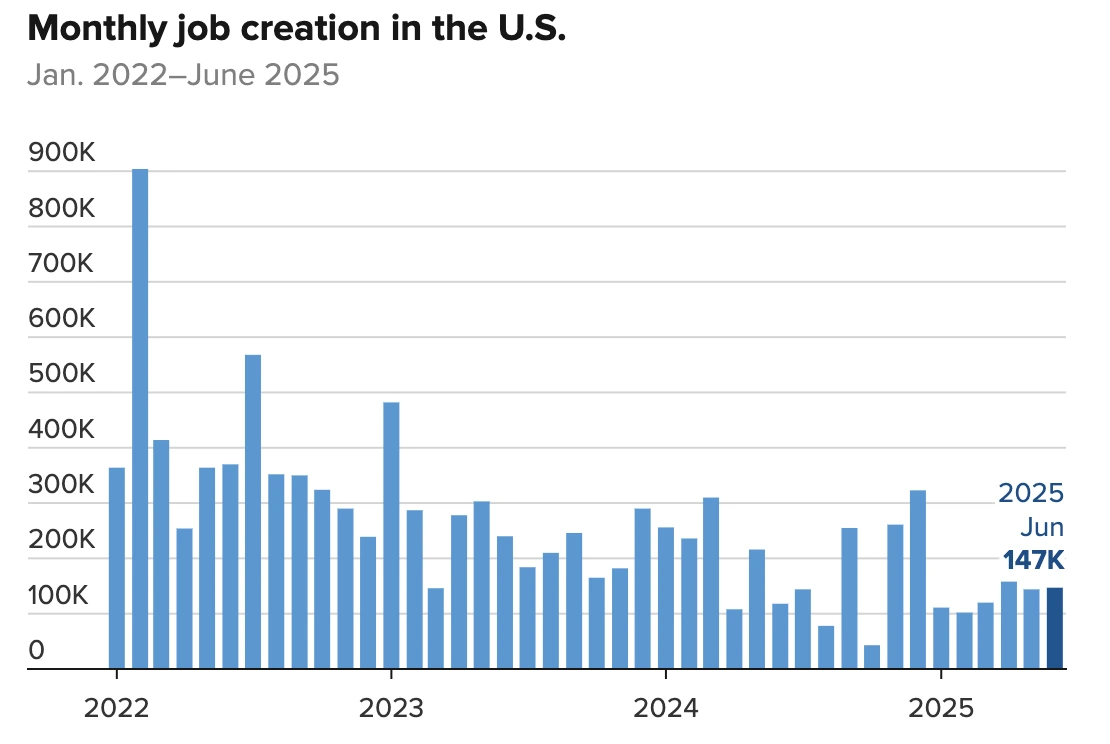
Not bad, considering economists were bracing for a slowdown. Wall Street took the news and ran with it, sending the S&P 500 and Nasdaq to fresh record highs. Again.
But here’s the twist: strong jobs usually means weak rate-cut odds. Traders have now priced out any chance of a rate cut in July and are scaling back their predictions for September. So while the market is climbing, the very safety net it was hoping for, Fed rate relief, is disappearing beneath its feet.
Foreign investors employ dollar hedging strategies
Here’s where things get even more interesting: foreign investors are losing faith in the dollar.
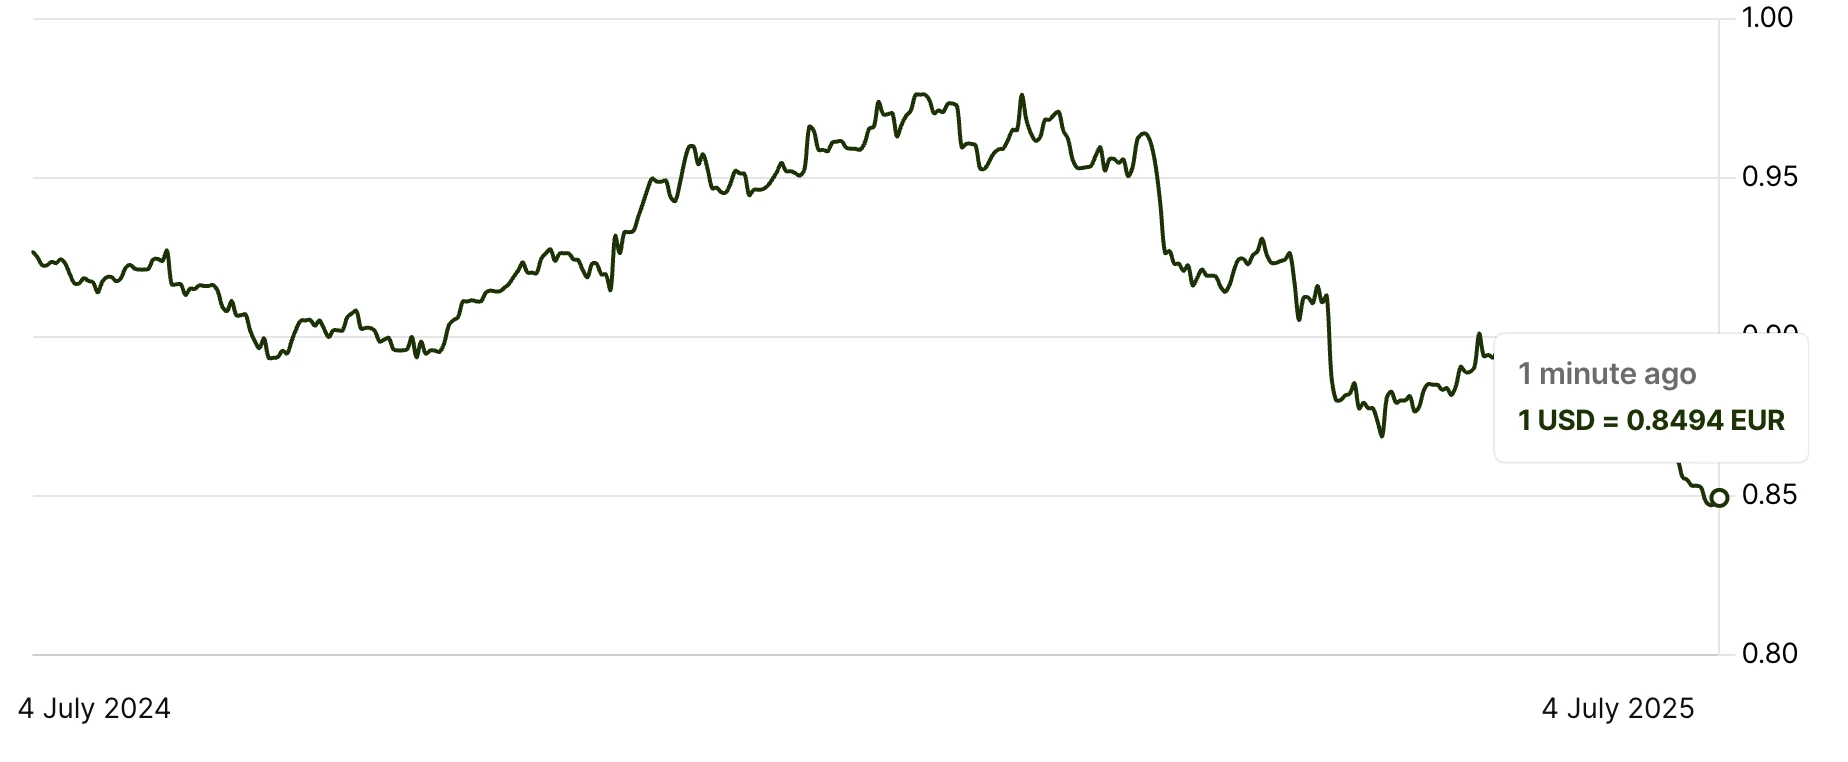
For years, global investors held U.S. stocks and bonds with minimal currency hedging. Why bother? The dollar was strong, and even when stocks dipped, currency gains often softened the blow. But now the dollar’s down 10% for the year - and 13% against the euro - and that old “natural hedge” has turned into a liability.
Asset managers across Europe, the UK, and Asia are quietly upping their hedge ratios. One Russell Investments client bumped theirs from 50% to 75%. BNP Paribas, Northern Trust, and others are trimming dollar exposure and buying up euros, yen, and Aussie dollars. Derivatives desks are buzzing, FX is back in the boardroom, and forward selling of the dollar is at a four-year high.
It’s not a panic, but it’s not exactly a vote of confidence either.
A rally fuelled by the US fiscal stimulus
Meanwhile, Washington is busy lighting the fuse on a $3.4 trillion tax-and-spend bill. It’s cleared the Senate, is moving through the House, and could be signed off by Trump just in time for Independence Day fireworks.
That sort of stimulus tends to juice the market - and clearly, it’s doing the trick. But let’s not forget the price tag. The U.S. national debt is already north of $36 trillion, and this bill would push it even higher. Traders may love the sugar high, but the hangover could be brutal.
Trade tensions take a breather though a tariff pause expiry looms
In a rare moment of calm, U.S.-Vietnam trade talks yielded a deal, and restrictions on chip design software exports to China were lifted. That helped lift shares of Synopsys and Cadence Design Systems. Even Nvidia’s stock hit record highs, pushing it closer to becoming the most valuable company in history.
However, he 90-day tariff pause ends next week, and Trump has made it clear he’s willing to “get tough”. If fresh tariffs are back on the table, things could take a different turn.
Volatility hedging vs. market confidence
According to analysts, investors aren’t exactly pulling out - but they’re definitely strapping on seatbelts. FX hedging is up. Volatility is lurking. And while AI hype and tech dominance are keeping the party going, the fundamentals are starting to wobble.
There’s no denying the resilience of the U.S. economy - at least for now. But the rally is beginning to feel like one of those magic tricks that looks amazing… right up until the wires start to show.
Is the S&P 500 rally flying or floating?
Right now, the S&P 500 feels untouchable. But step back, and you’ve got:
- A Fed that’s out of moves,
- A dollar that’s lost its shine,
- And foreign investors quietly shifting into defence mode.
That’s not to say a crash is coming. But a correction? A wobble? A sudden shift in tone? That wouldn’t be surprising at all. The question isn’t whether this rally has legs - it’s whether those legs are standing on solid ground, or just a very shiny patch of quicksand.
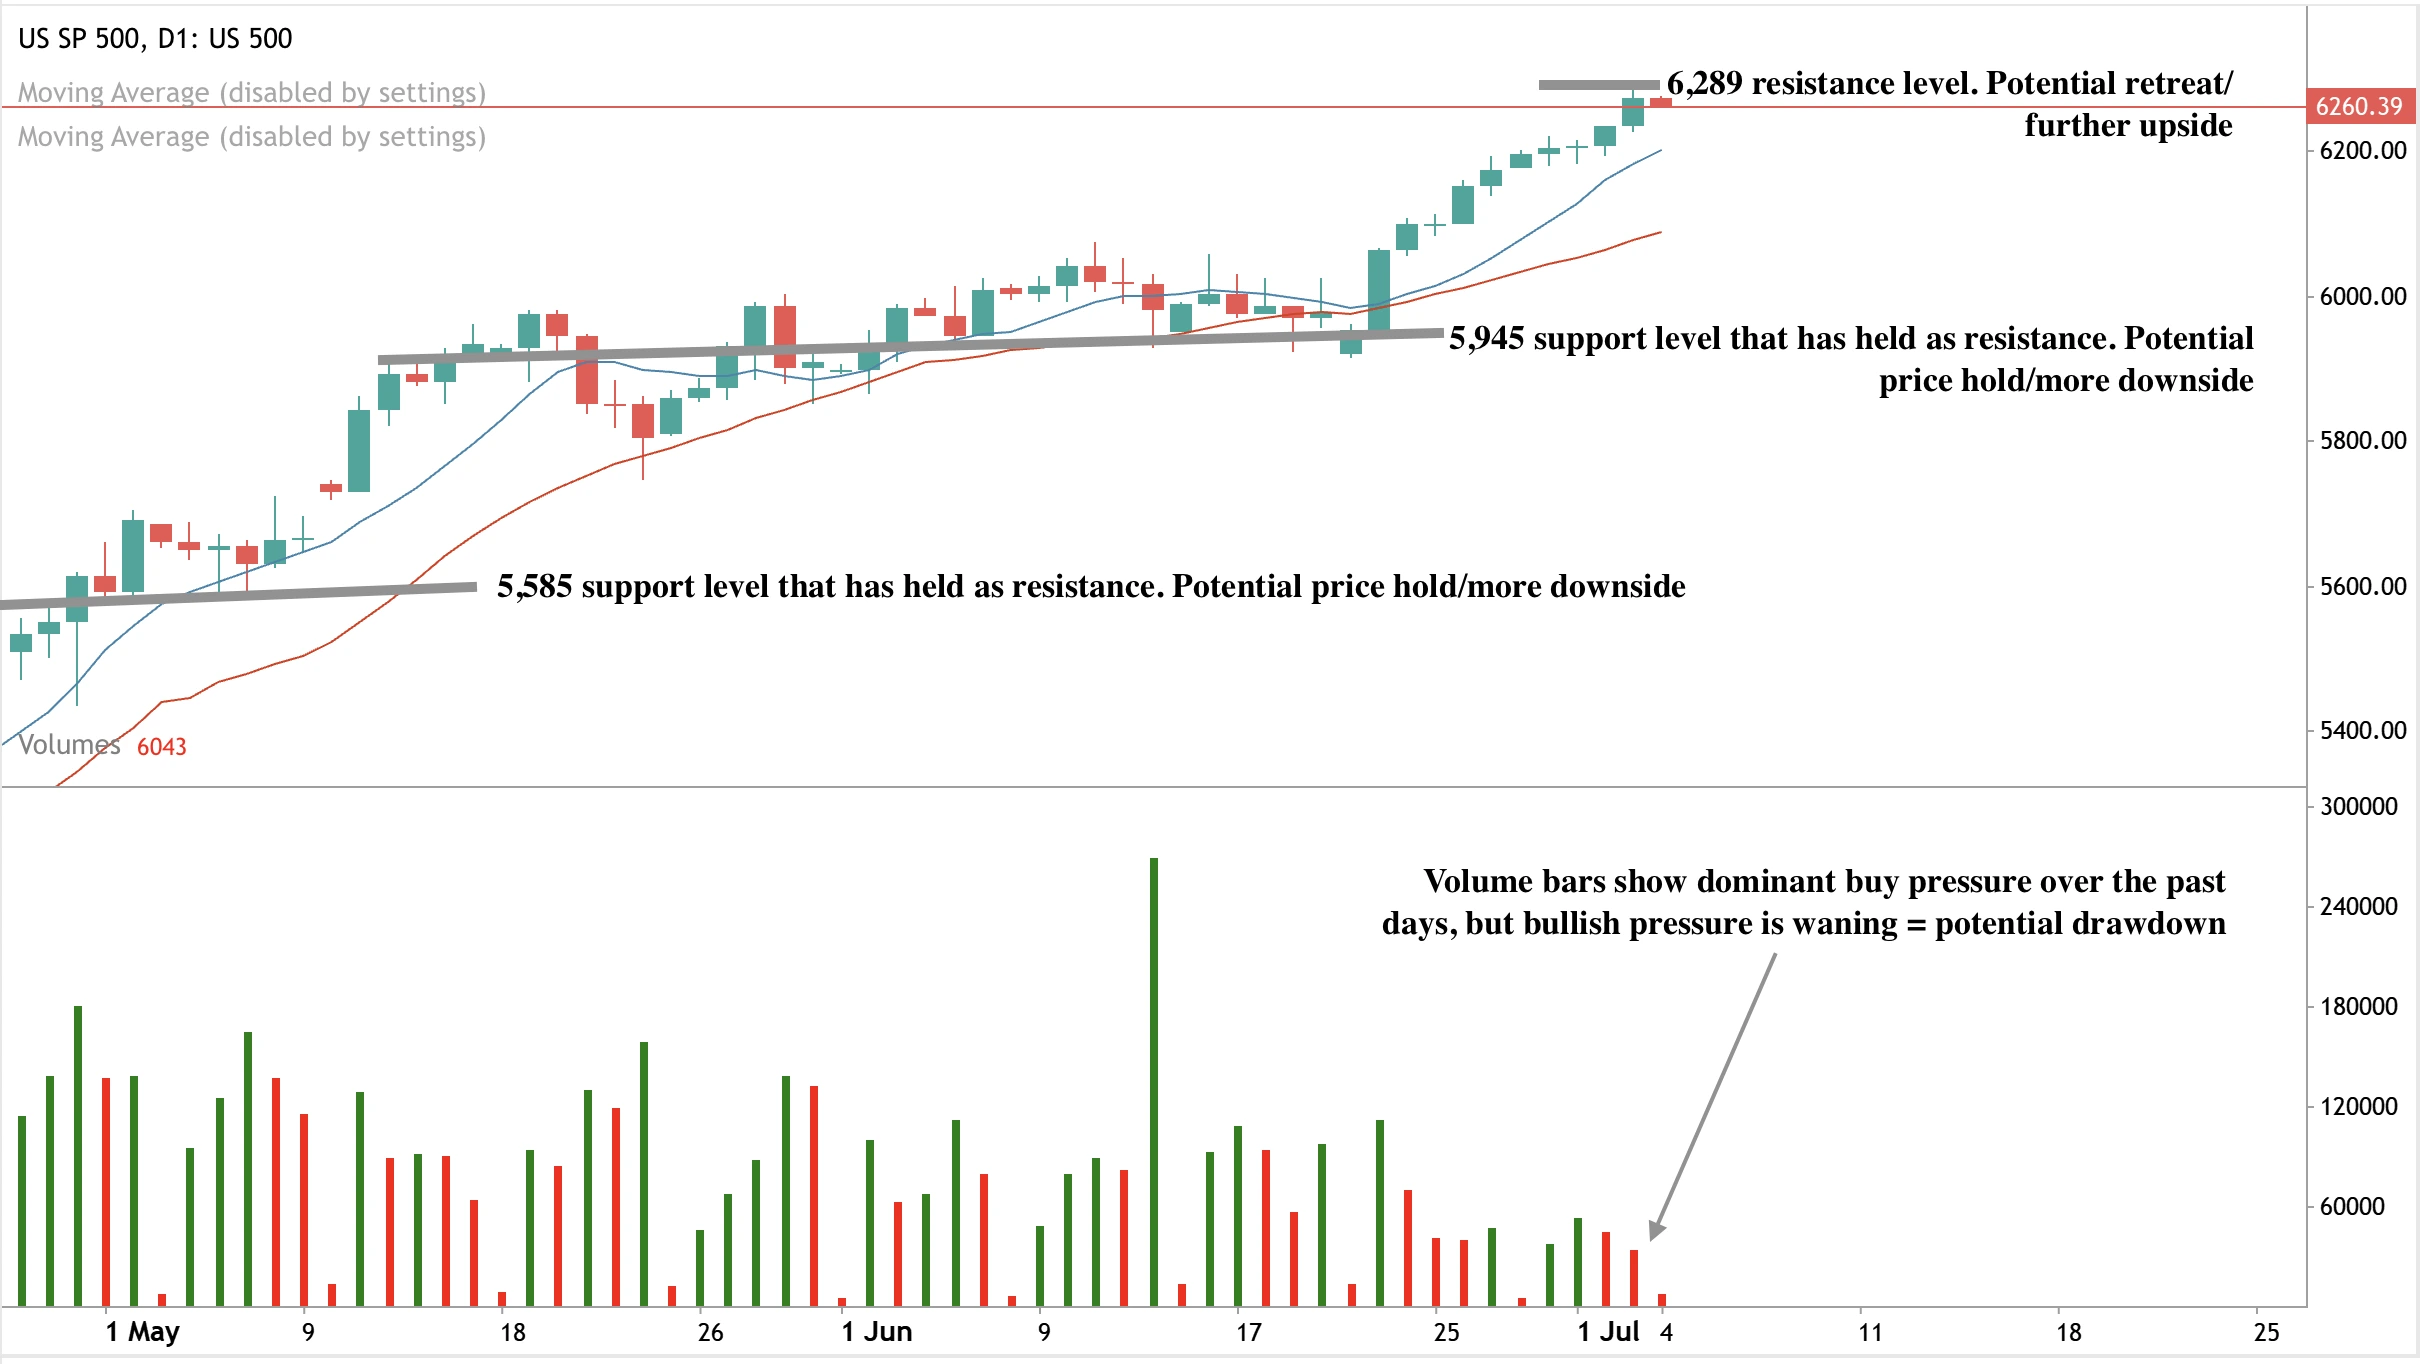
At the time of writing, the S&P 500 rally is seeing some exhaustion with a red candle forming, hinting at a potential drawdown. The potential bearish narrative is buttressed by the volume bars indicating that buy pressure is currently waning. Should we see a significant drawdown, prices could find support at the $5,945 and $5,585 support levels. Conversely, if the uptick resumes, prices could encounter resistance at the $6,289 price level.
Is the S&P 500 going to break yet another record? You can speculate on US markets with a Deriv MT5, Deriv cTrader, or a Deriv X account.
XRP price surges as $5 target comes into view
It’s the question echoing through crypto forums, late-night Twitter threads, and the ever-hopeful corners of the XRP Army: could XRP finally be gearing up for a proper push to that long-awaited $5 milestone?
It’s the question echoing through crypto forums, late-night Twitter threads, and the ever-hopeful corners of the XRP Army: could XRP finally be gearing up for a proper push to that long-awaited $5 milestone?
After a rocky few years of courtroom drama, price swings, and speculative moonshots, XRP has managed to hold its ground above the $2 mark - but it’s hardly set the world on fire. Still, something’s brewing beneath the surface, according to analysts. Whale activity is picking up, wallet data is flashing signs of confidence, and the community? Well, they’ve never been short on faith.
But let’s be honest - talk is cheap, and $5 isn’t exactly pocket change. So, is this just another round of hopium-fuelled chatter, or is there a real case to be made for XRP hitting new heights? Let’s unpack the hype, the hurdles, and the hard data behind this crucial question.
XRP prediction: Price power or pipe dream?
Let’s start with the basics. XRP last peaked at $3.40 in January, a solid run, but still shy of that elusive $5 mark. Since then, it’s drifted around the low-to-mid $2 range. And while it’s commendable that every monthly candle since December 2024 has closed above $2, trading volumes tell a different story.
Lower volume generally means reduced market participation, and bulls will need to reverse that trend if they want any real momentum.
XRP whale activity
But here’s where things get interesting. Recent on-chain data from CryptoQuant shows that whale activity is heating up. XRP’s 90-day moving average for whale flows flipped back into positive territory in May, breaking a months-long trend of negative flows that spanned January through April.
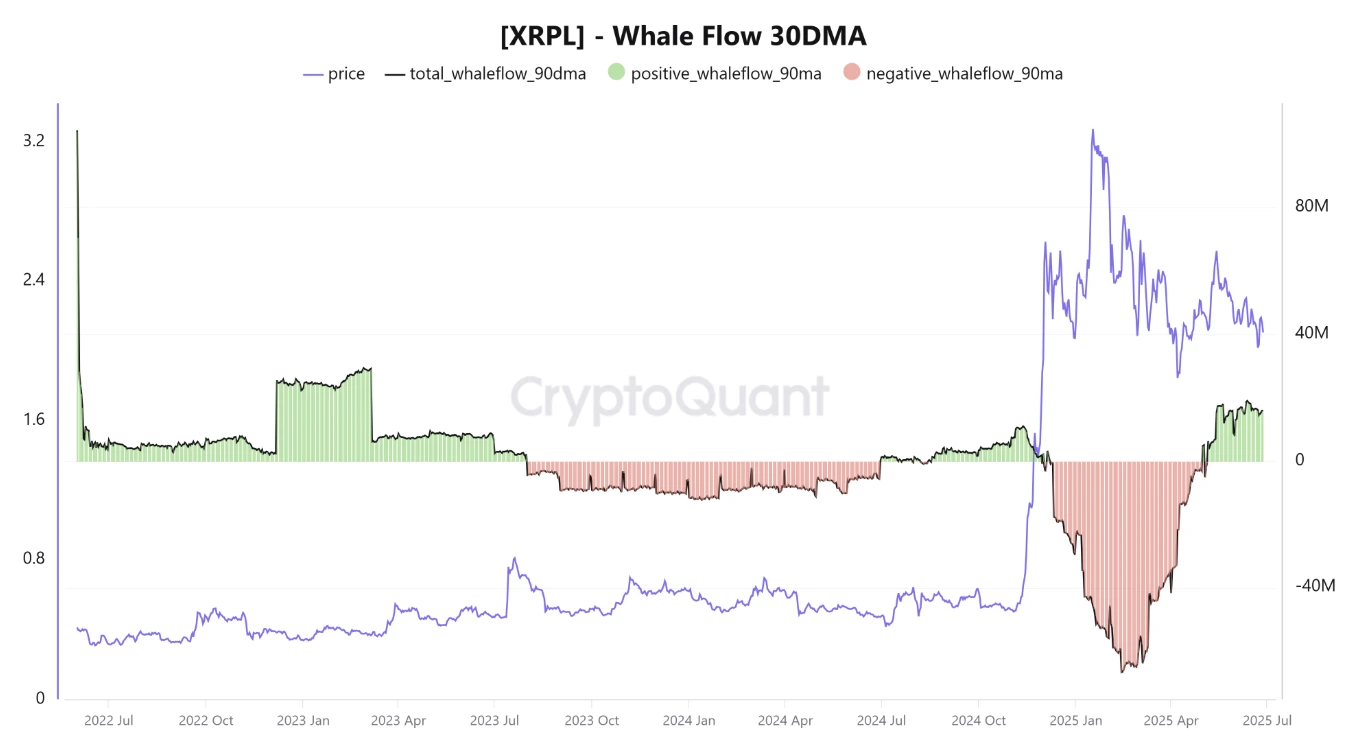
That shift could mean large players, those with serious skin in the game, are quietly positioning for a breakout. It’s not the first time this has happened either. Back in August 2024, a similar uptick in whale flows preceded a massive 420% breakout in Q4. If history rhymes, Q4 2025 could have something in store.
Zoom out a little, and you’ll see another layer of bullishness. According to futures trader Dom, wallets holding over 1 million XRP have climbed to a record 2,850. Meanwhile, wallets with more than 10,000 XRP have grown by 6.2% year-to-date, now sitting at 306,000 addresses.
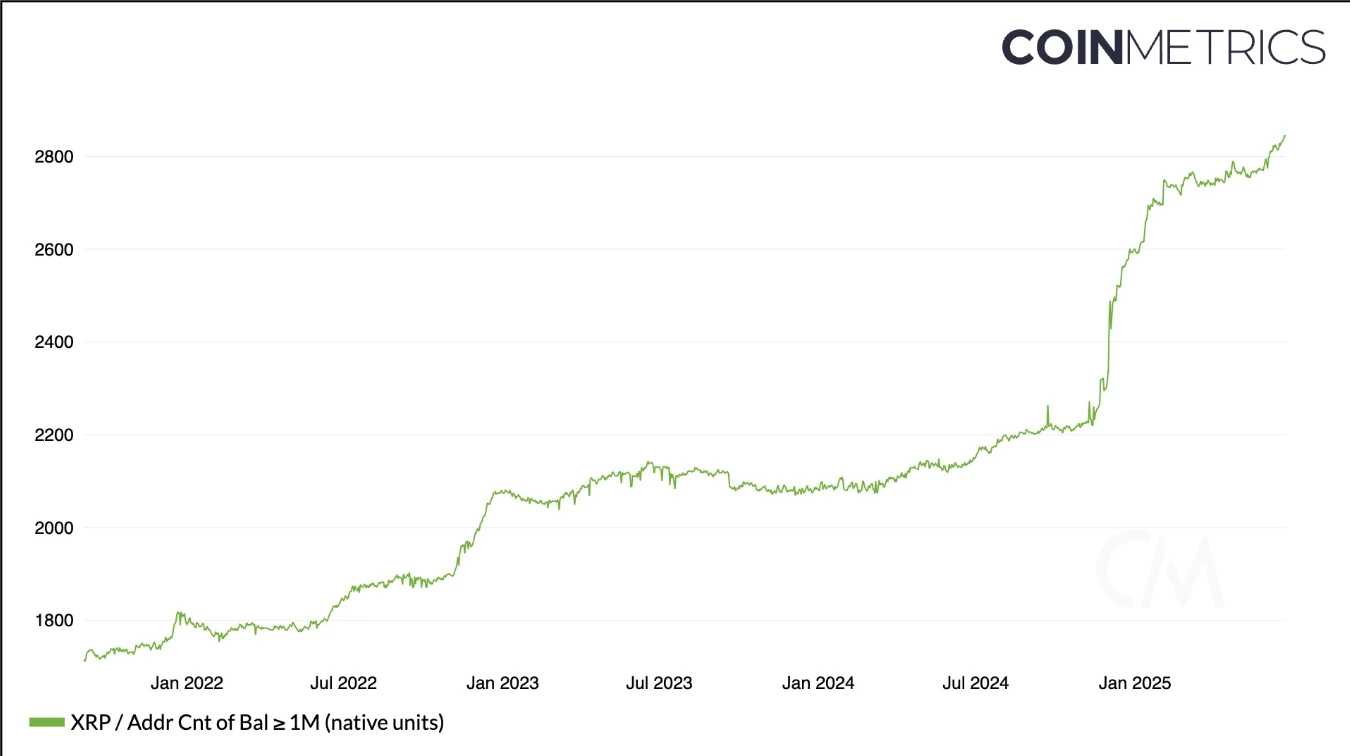
So even though the price has been doing the sideways shuffle, big players - and mid-sized ones too - are accumulating. And they’re not just holding. They’re doubling down.
The faith factor and the XRP $5 potential
Now, if you’ve spent any time in XRP’s online circles, you’ll know the $5 question is just the beginning. Some community predictions stretch far beyond that - we’re talking triple digits, even four-digit XRP forecasts.
Is it realistic? Let’s break it down. XRP’s market cap currently sits around $130 billion.
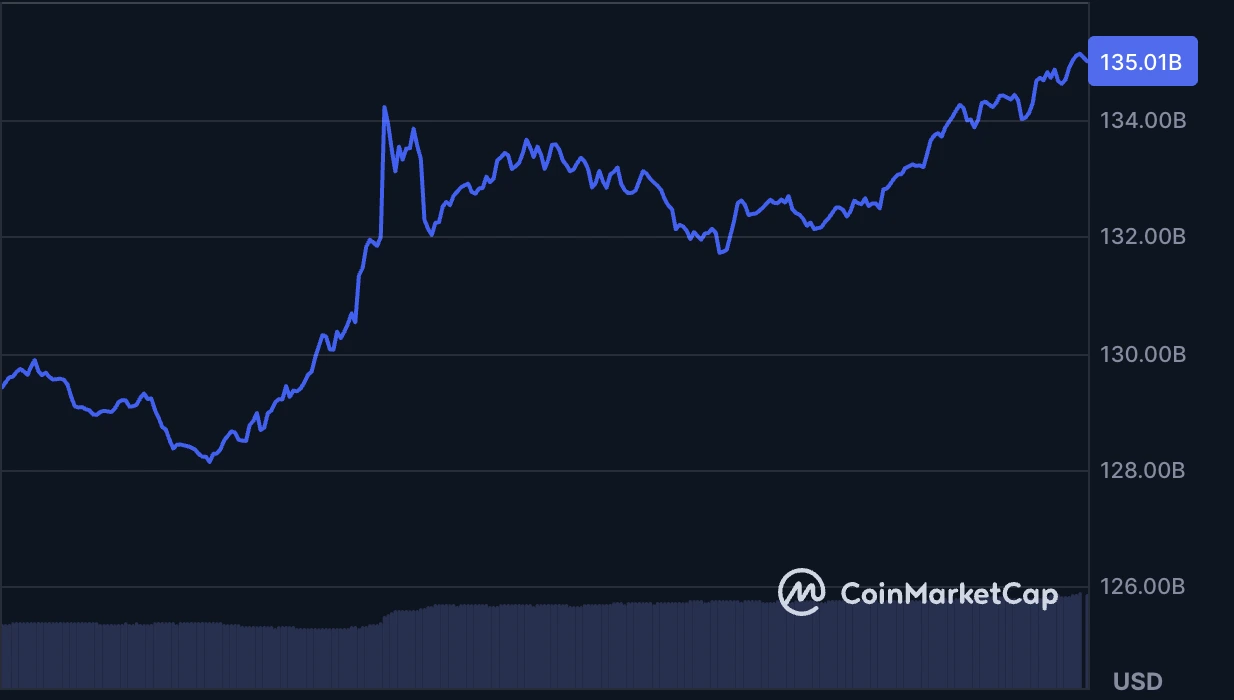
A $5 price would roughly double that, according to experts, and this is achievable, especially in a broader crypto bull cycle. But when people start throwing around numbers like $1,000 or $10,000 per XRP, things get a little... optimistic.
For context: out of 6.61 million XRP wallets, 5.36 million hold 500 XRP or fewer. So, the majority of holders wouldn’t see life-changing money unless XRP pulled off something monumental. At $100 per coin, those with 25,000 XRP would rake in $2.5 million - but those holding 500 tokens (the majority) would only net $50,000. Not bad, but not exactly “unimaginable wealth.”
Hence the bold predictions. For many small-scale holders, only a four-digit XRP would really make the difference. Whether that’s delusional or just determined depends on who you ask.
XRP SEC case updates
Of course, no XRP discussion is complete without mentioning the ongoing SEC case. On 26 June, Judge Analisa Torres denied a motion seeking an indicative ruling, reinforcing that private settlements can’t override a court’s final judgment. In plain English: Ripple can’t cut a backdoor deal to dodge the consequences.
The legal cloud still looms, and until it lifts, it’s hard to imagine institutional money pouring in full force. Any real push to $5 will likely need a favourable resolution, or at least some clarity, in this regulatory tug-of-war.
The XRP community shouldn’t just wait but build
While some holders dream of Lambos and moon landings, others urge action. Influencer Coach JV recently lit a fire under the XRP community, encouraging holders not just to wait for a saviour moment but to build something in the meantime.
Whether it’s creating educational content, developing apps on the XRP Ledger, or simply spreading adoption, the message is clear: wealth won’t just be handed to you - you’ve got to earn it. It’s a mindset shift from passive speculation to active participation, and it might be exactly what XRP needs to go from cult favourite to real-world powerhouse.
XRP outlook: Is $5 really on the table?
Here’s the honest take: $5 XRP is not a certainty, but it’s far from impossible. With the right mix of renewed volume, legal clarity, whale support, and community action, it’s a realistic target, particularly in a wider bull run.
But it won’t happen by belief alone. The road to $5 is paved with more than just hope. It needs utility. It needs legitimacy. And, yes - it needs a bit of luck. Still, if XRP has proven anything over the years, it’s this: it’s not going anywhere quietly.
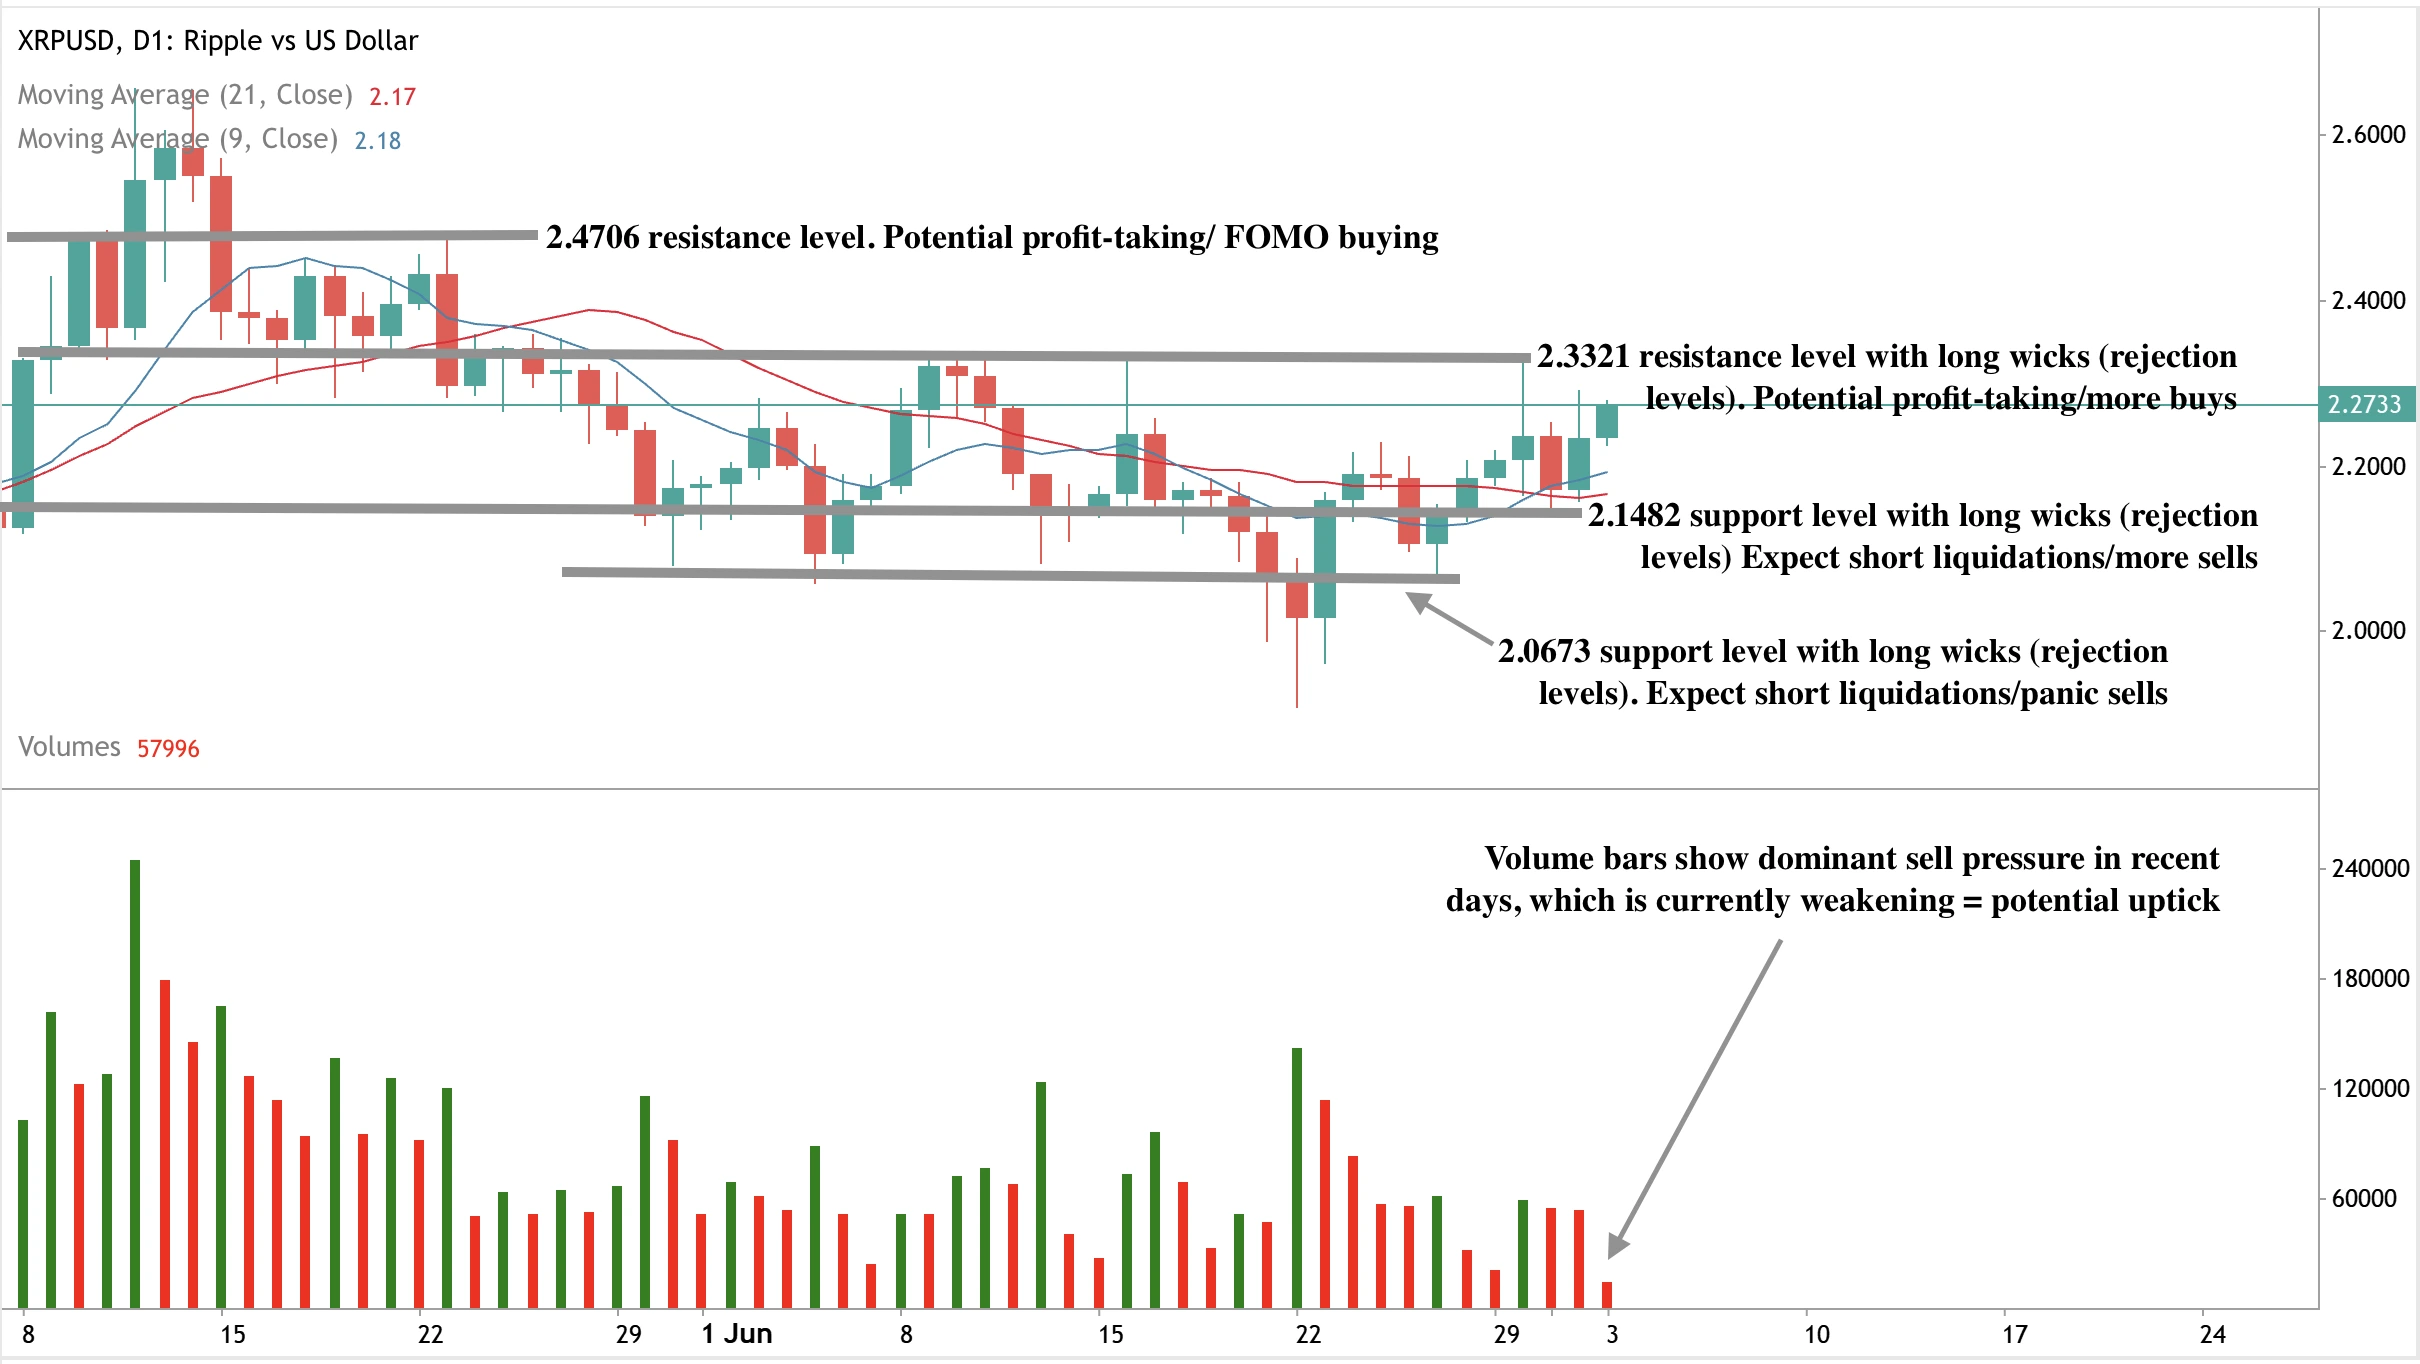
At the time of writing, XRP is still surging but within a sell zone, hinting that we could see a potential drawdown. However, the volume bars show that sell pressure is weakening, hinting that we could see an uptick before any potential drawdown. Should we see an uptick, prices could encounter resistance at the $2.3321 and $2.4706 price levels. Conversely, should we see a significant drawdown, prices could find support floors at the $2.1482 and $2.0673 price levels.
Will XRP hit $5? Speculate on the price trajectory of XRP with a Deriv MT5, Deriv cTrader, or a Deriv X account.
Sorry, we couldn’t find any results matching .
Search tips:
- Check your spelling and try again
- Try another keyword